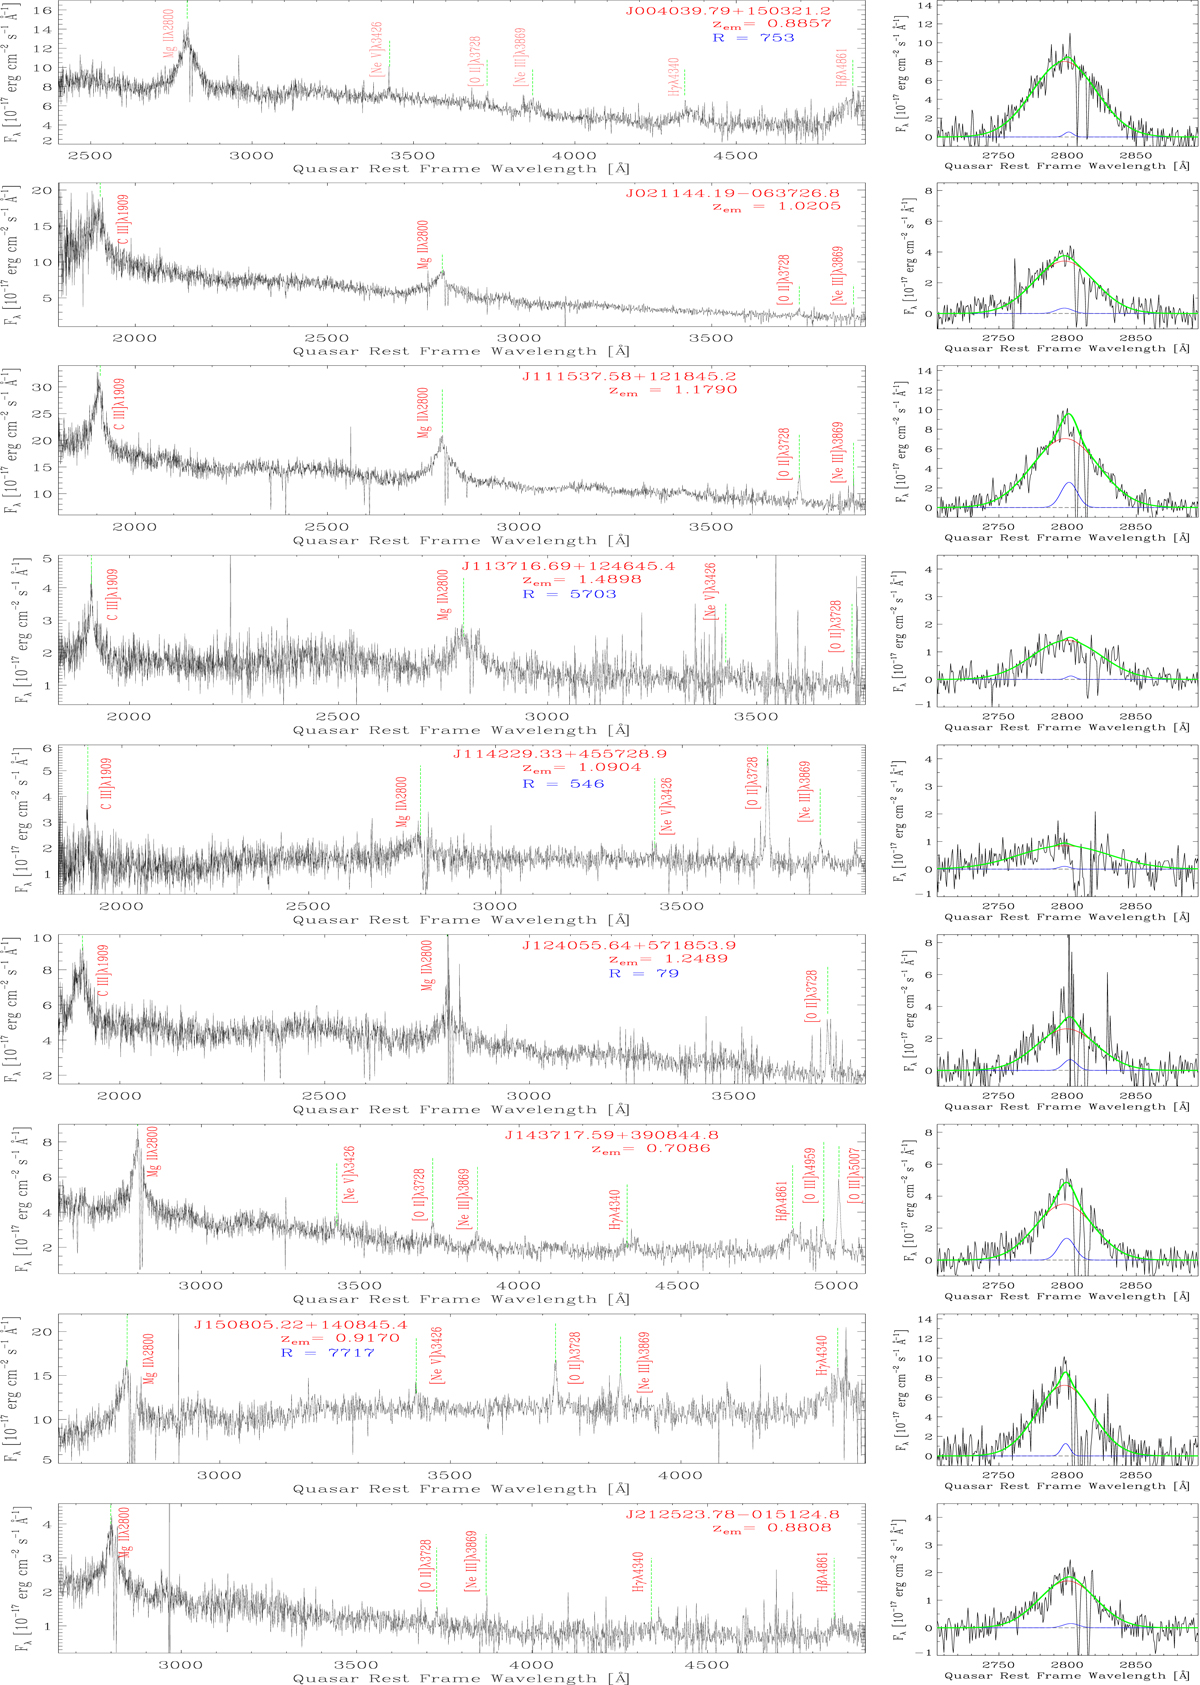
Fig. 2.
Download original image
SDSS quasar spectra. Left panel: green dashed lines indicate the positions of emission lines. The emission line redshifts zem are determined from the [O II] emission lines. The blue symbols are the radio loudness of quasars: ![]() . Right panel: residual spectra of quasars where the continuum+iron fits have been subtracted from the original spectra. The blue and red lines are the narrow and broad Gaussian function fits, respectively. The green lines are the sum of the blue and red lines.
. Right panel: residual spectra of quasars where the continuum+iron fits have been subtracted from the original spectra. The blue and red lines are the narrow and broad Gaussian function fits, respectively. The green lines are the sum of the blue and red lines.
Current usage metrics show cumulative count of Article Views (full-text article views including HTML views, PDF and ePub downloads, according to the available data) and Abstracts Views on Vision4Press platform.
Data correspond to usage on the plateform after 2015. The current usage metrics is available 48-96 hours after online publication and is updated daily on week days.
Initial download of the metrics may take a while.