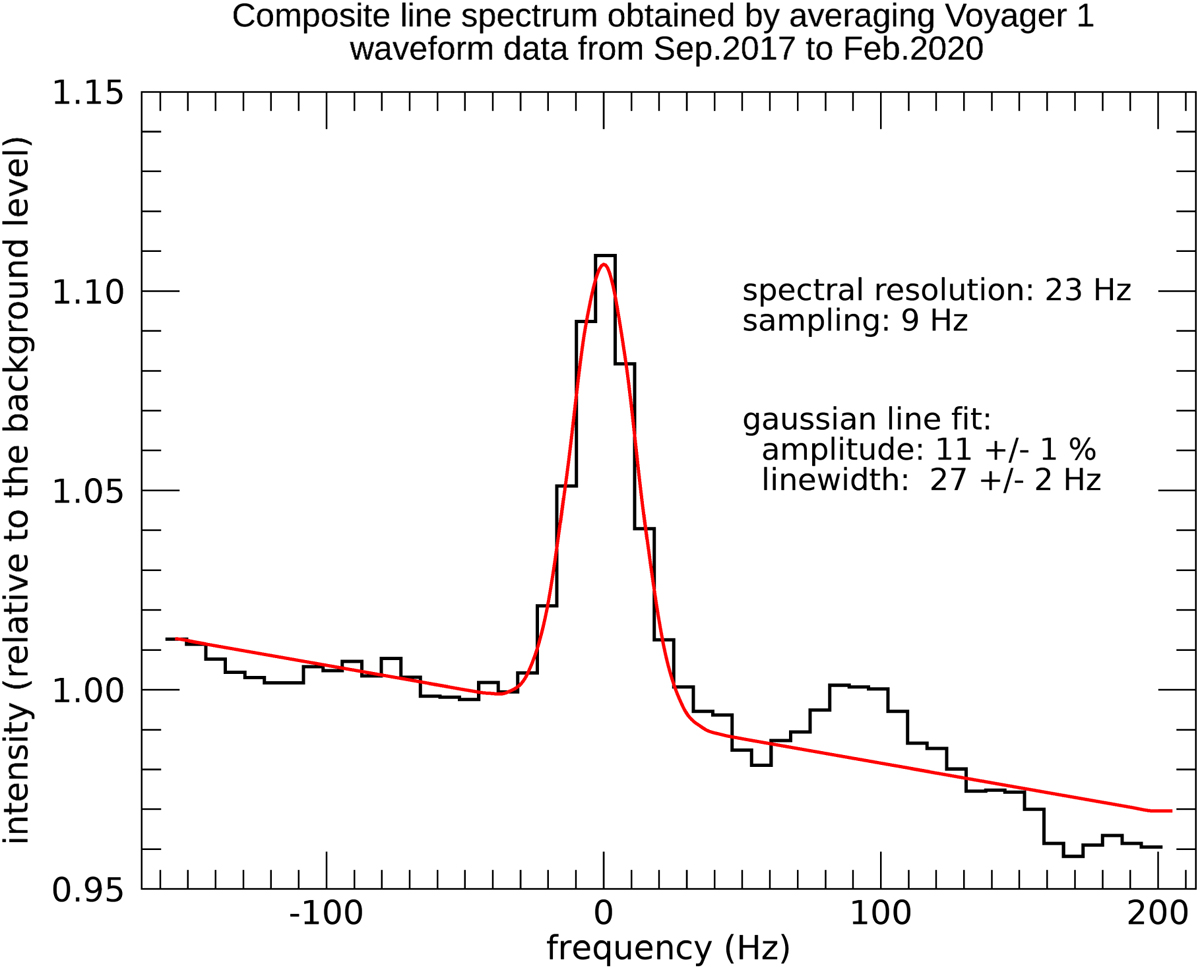
Fig. 3.
Download original image
Line profile (linear scale) obtained by averaging 42 600 spectra shifted to a common central frequency by fitting a Gaussian profile (in red). The total intensity exceeds the background by 11%, which means that the contribution of the line is smaller than the background level by about one order of magnitude and that the line width is not significantly different from the spectral resolution.
Current usage metrics show cumulative count of Article Views (full-text article views including HTML views, PDF and ePub downloads, according to the available data) and Abstracts Views on Vision4Press platform.
Data correspond to usage on the plateform after 2015. The current usage metrics is available 48-96 hours after online publication and is updated daily on week days.
Initial download of the metrics may take a while.