| Issue |
A&A
Volume 658, February 2022
|
|
|---|---|---|
| Article Number | A67 | |
| Number of page(s) | 21 | |
| Section | Planets and planetary systems | |
| DOI | https://doi.org/10.1051/0004-6361/202141398 | |
| Published online | 01 February 2022 | |
Mafic mineralogy assemblages at the Chang’e-4 landing site: A combined laboratory and lunar in situ spectroscopic study
1
Shandong Key Laboratory of Optical Astronomy and Solar-Terrestrial Environment, School of Space Science and Physics, Institute of Space Sciences, Shandong University,
Weihai
264209,
PR China
e-mail: This email address is being protected from spambots. You need JavaScript enabled to view it.
2
Shanghai Institute of Technical Physics, Chinese Academy of Science,
Shanghai
200083,
PR China
e-mail: This email address is being protected from spambots. You need JavaScript enabled to view it.
3
CAS Center for Excellence in Comparative Planetology, Chinese Academy of Sciences,
Hefei
230026,
PR China
Received:
27
May
2021
Accepted:
2
November
2021
Abstract
Context. Chang’e-4 (CE-4) provides unprecedented information about lunar materials exposed by the South Pole-Aitken (SPA) basin. Diverse results have been obtained from previous interpretations of CE-4 visible and near-infrared (VNIR) spectra. Some studies suggest that materials at the CE-4 landing site are dominated by olivine and orthopyroxene, but others argue that only a small amount of olivine should be exposed at the CE-4 landing site.
Aims. Laboratory spectroscopy studies using the Engineering Model of CE-4 Visible and Near-infrared Imaging Spectrometer (VNIS) are critical in constraining the accurate mineral proportions and composition of soils and boulders at the CE-4 landing site.
Methods. VNIR spectra of nine lunar analogs – prepared by mixing orthopyroxene (OPX), clinopyroxene (CPX), olivine (OL), and plagioclase – were acquired using the CE-4 VNIS Engineering Model. The spectral indices model and modified Gaussian model were developed to estimate CPX/(CPX+OPX) and OL/(OL+CPX+OPX) and are applicable to the in situ spectra acquired by the Yutu-2 VNIS spectrometer.
Results. The lunar rocks and regolith at the CE-4 landing site excavated by the Finsen impact are CPX-rich with limited OL (CPX:OPX:OL = 56:29:17). The mineral chemistries of the four lunar rocks show Mid-Ca, Fe pyroxene, and Mid-Mg OL (Fo60−79), providing critical constraints for mineral compositions in the SPA compositional anomaly. These rocks exhibit high M1 intensity ratios, indicating that they were crystallized at a high temperature (980–1300 °C) and a rapid-cooling magmatic system produced by impact melt differentiation or volcanic resurfacing events.
Key words: Moon / planets and satellites: composition / techniques: spectroscopic / planets and satellites: surfaces / infrared: planetary systems / techniques: imaging spectroscopy
© ESO 2022
1 Introduction
The Chang’e-4 (CE-4) spacecraft with the Yutu-2 rover successfully landed on the floor of the Von Kármán crater (44.4° S, 176.2° E) within the South Pole-Aitken (SPA) basin (Wilhelms et al. 1979; Moriarty & Pieters 2018; Di et al. 2019; Liu et al. 2019; Wu et al. 2019), facilitating the first in situ investigations of materials on the far side of the Moon. The Von Kármán crater floor has previously been flooded by several lava flows and later extensively covered by ejecta from the Finsen crater (Huang et al. 2018, 2020; Ling et al. 2019; Qiao et al. 2019; Fu et al. 2020; Guo et al. 2021). The Finsen crater is located at the boundary of the SPA compositional anomaly (SPACA) with high Ca- and Fe-pyroxene compositions compared with the surrounding regions, which are rich in Mg-pyroxene, and are therefore named the Mg-pyroxene annulus in the SPA basin (Moriarty & Pieters 2018; Moriarty et al. 2020). The materials at the CE-4 landing site excavated and ejected by the Finsen crater may therefore provide clues regarding mineral assemblages and the composition of the SPACA.
The Yutu-2 rover carried a visible and near-infrared imaging spectrometer (VNIS) composed of two detection channels: a visible and near-infrared (VNIR) imaging spectrometer (450–950 nm) and a short-wave infrared spectrometer (SWIR, 900–2400 nm), enabling an in situ mineralogy survey of materials exposed by SPA impact events (He et al. 2019; Li et al. 2019a,b). However, the reported mineralogy from VNIS spectral investigations appears to contain anomalies and has been disputed (Moriarty et al. 2020). A modified Gaussian model (MGM) was recently used to show that materials at the CE-4 landing site are likely dominated by olivine (OL) and orthopyroxene (OPX) (Li et al. 2019c; Gou et al. 2019). Hu et al. (2019) and Lin et al. (2020), based on Hapke’s radiative transfer model, argued that materials at the CE-4 landing site are rich in plagioclase (PLAG) and OPX only with a small amount of OL. Through a preliminary spectral check of CE-4 spectra, Chen et al. (2020) suggested that the mafic mineralogy at the CE-4 landing site may be mainly comprised of CPX-bearing minerals with intermediate composition and probably dominated by pigeonite. According to the remote observations of the Kaguya Multi-band Imager, the materials in the Von Kármán crater are dominated by PLAG (~54 wt.%) and OPX (~24 wt.%) with only a low abundance of OL (~9 wt.%) (Lemelin et al. 2016, 2019; Qiao et al. 2019). The abundance ratio of clinopyroxene (CPX) and OPX is ~0.7 at the CE-4 landing site based on the VNIR spectra of the Chandrayaan-1 Moon Mineralogy Mapper (Ling et al. 2019).
In addition to direct observation and interpretation of in situ VNIS spectra, laboratory spectroscopic studies on lunar soil analogs provide another means to establish more reliable models and better constrain the mineralogy at the CE-4 landing site. In this study, we prepared a series of lunar soil analogs by mixing four terrestrial minerals: CPX, OPX, OL, and PLAG. The VNIR spectra of these analogs were characterized using a backup instrument of the CE-4 VNIS payload (Engineering Model, EM) to build improved models and better constrain the mineralogy and composition of lunar rocks and regolith at the CE-4 landing site.
2 Experimental and analytical methods
Four natural terrestrial minerals including augite (CPX, ρ = 3.34 g cm−3), hypersthene (OPX, ρ = 3.54 g cm−3), OL (ρ = 3.42 g cm−3), and PLAG (ρ = 2.88 g cm−3) purchased from Shuiyuan Shanchang Mineral Specimen Co. LTD were used as endmembers. Minerals were first ground and sieved to a grain size range of 20–100 μm. Subsequently, mineral powders were mixed in different volume fractions (Table B.1) to obtain lunar soil analogs (~170 g for each mixture) with variable CPX/(CPX+OPX) values (19.4–65.6.%) and plagioclase volume fractions (34.1–59.5 vol.%) according to remote sensing detections (Ling et al. 2019; Qiao et al. 2019). It should be noted that the spectral features of OL were not observed in the orbital VNIR spectra at the CE-4 landing site; however, OL below the detection limit could not be excluded (Ling et al. 2019). Therefore, OL was added to the mixtures up to 27.5 vol.%. Furthermore, ilmenite and nanophase-iron as well as other space weathering products were not considered in this study.
Elemental compositions (i.e., Si, Ti, Al, Cr, Fe, Mn, Mg, Ca, Na, K, and P shown in Table B.2) and mineralogical characterization (pyroxene and OL) of the samples were confirmed by X-ray fluorescence (XRF) and Raman spectroscopy. VNIR reflectance spectra of mixtures were obtained in the laboratory using the CE-4 VNIS EM, which is a copy of the VNIS payload aboard the Yutu-2 rover. In addition, VNIR spectra of these samples were also acquired by another VNIR spectrometer (FieldSpec 4 Hi-Res VNIR spectrometer, Analytical Spectral Devices Inc., i.e., ASD) to evaluate the instrumental effects and spectral properties of the VNIS payload.
3 VNIR spectral production
3.1 CE-4 spectral data and preprocessing
Here, we analyzed a level 2B VNIS radiance dataset collected from the first to the twenty-sixth lunar day of the CE-4 mission carried out as part of the Ground Research and Application System of Chinese Lunar Exploration Program. As part of this work, we used 10 spectra of four lunar rocks and 89 spectra of lunar regolith, including the spectra of the same lunar soils obtained at different optical geometry (i.e., Photometric Experiments 1 and 2). The images and spectra of the four lunar rocks are shown in Figs. 1 and 2. The data were corrected using a compensation matrix owing to the change in the working environment of the CE-4 VNIS payload. The data were then divided by the distance-corrected solar irradiance data (Gueymard 2004; Chen et al. 2020) and converted into reflectance factors (REFFs) (Hapke 2012). Subsequently, REFF spectra were photometrically corrected to the same illumination-viewing geometry as the laboratory spectra (i = 60°, e = 45°, g = 90°) using the Lommel–Seeliger model built based on the data acquired on the tenth lunar day (Qi et al. 2020). The VNIR bands (450–945 nm) were connected to the SWIR bands (900–2395 nm) based on the average value in the overlapping spectral region (900–945 nm). The reflectance spectra were then smoothed using the Savitzky-Golay algorithm (Savitzky & Golay 1964).
3.2 Continuum removal
Continuum removal was conducted before characterizing the spectral absorption features. A linear spectral continuum in wavenumberspace (appear curved in wavelength space) with free slope and offset (Fig. 2a) was defined by two tie points in the range of 475–815 nm and 815–1985 nm for ASD and VNIS EM data (Sunshine et al. 1990; Klima et al. 2008). However, this method did not work well for the spectra acquired by the CE-4 VNIS payload, likely because of the complex space weathering effects on the lunar surface. Therefore, a two-part linear continuum technique (Fig. 2b) was applied to the in-flight VNIS spectra automatically determined by three tie points (743 ± 24 nm, 1438 ± 69 nm, 1629 ± 13 nm) (Martinot et al. 2018; Moriarty & Pieters 2018; Chen et al. 2020).
3.3 Spectral indices model
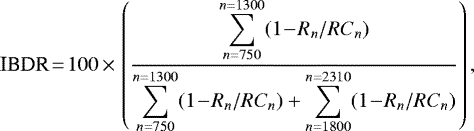
The CPX, OPX, and OL contents can be characterized using the Spectral Indices Model (SIM) including OPX_INDEX (Eq. (1)), CPX_INDEX (Eq. (2)), and the integrated band depth ratio (IBDR) (Eq. (3)) (see Cloutis et al. 1986, Mustard et al. 2011, Staid et al. 2011 and Horgan et al. 2014). OPX_INDEX was designed to detect OPX absorption features at 930 nm and 1815 nm relative to the spectral shoulder of OPX at ~1330 nm, and CPX_INDEX was defined as an indicator of two CPX absorption features at 1000 and 2200 nm and the reflectance shoulder at ~1500 nm. The IBDR is the relative fraction of integrated band depth at 1000 nm (IBD1 in 750–1300 nm) of the total IBD at 1000 and 2000 nm (IBD2 in 1800–2310 nm). The spectral indices were calculated as follows:
 (1)
(1)
 (2)
(2)
 (3)
(3)
where Rn represents the reflectance, and RCn is the value of a linear continuum between 750 and 1300 nm.
3.4 Modified Gaussian Model
The MGM is an improved approach for VNIR spectral deconvolution from composite absorption features to individual absorption bands produced byFe2+ electronic transitions in pyroxene and OL (Sunshine et al. 1990; Sunshine & Pieters 1998). The MGM was used to estimate the modal abundance of mineral end members in our lunar soil analogs. The reflectance spectra of nine mixtures were analyzed with MGM to study the relationship between the relative band strengths and mineral abundance. It should be noted that OL was considered during the MGM analysis despite the low abundance and may be masked by the spectral features of pyroxene. Two additional spectral bands were added in the MGM deconvolution which were attributed to the spectral feature of pyroxene at ~450 nm and a fall-down spectral feature at ~2500 nm for CE-4 in-flight spectra (Fig. 2d).
 |
Fig. 1 CMOS images of lunar rocks and regolith observed by the Yutu-2 rover. |
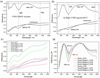 |
Fig. 2 (a−b) Reflectance spectra before and after continuum removal acquired by VNIS Engineering Model and CE-4 VNIS payload. (c− d) VNIR spectra of CE-4 lunar rocks before and after continuum removal. |
4 Results and discussion
4.1 Comparison of ASD and VNIS EM spectra
Comparison of ASD and VNIS EM spectra led to a better understanding of spectral properties due to instrument effects. The spectra of mixed sample No. 01 acquired by ASD and VNIS EM were different (Fig. B.1). Generally, the spectral absorption features agree well with each other in terms of the peak shapes and positions. The reflectance values of the ASD spectra before continuum removal were higher than those of the VNIS EM in all channels. For the continuum removed spectrum, an obvious difference was observed below ~730 nm. A doublet feature at ~505 nm and ~600 nm was observed in the VNIS EM spectra. In addition, the absorption features at ~1 μm of the ASD spectra are significantly wider than those in the VNIS EM spectra. These differences could be due to the different detection modes of ASD and VNIS EM. An acousto-optic tunable filter was used to collect the reflected light at a certain energy and record the reflectance, channel by channel (He et al. 2019; Li et al. 2019a,b). For ASD, the reflectance values of all channels were acquired once using a spectrometer to split light based on different wavelengths. Despite this, the Str_CPX/(Str_CPX+Str_OPX) and Str_OL/(Str_OL+Str_CPX1+Str_OPX1) acquired using MGM with VNIS EM spectra and ASD spectra, respectively, are comparable, except for the OL spectra feature at ~850 nm (Figs. B.2a,b). Subsequently, we built two polynomial models using the Str ratios obtained from the ASD spectra, and the models were used to predict CPX/(CPX+OPX) and OL/(OL+CPX+OPX) using the spectra of VNIS EM. The CPX/(CPX+OPX) ratios are slightly underestimated but acceptable (RMSE = 4.38) (Fig. B.2c), but the OL/(OL+CPX+OPX) ratios are clearly underestimated, which may be caused by the different Str ratios of the OL spectral feature at ~850 nm and pyroxene features at ~1000 nm derived from the spectra of VNIS EM and ASD (blue triangle in Fig. B.2b).
The absorption feature at ~1000 nm is composed of the spectra collected by two VNIS AOTFs in VNIR bands (450–945 nm, including the 850 nm feature of OL) and SWIR bands (900–2395 nm, including spectral features of CPX and OPX at ~1000 nm) (He et al. 2019; Li et al. 2019a,b). The different spectral detection modes of the two AOTFs (VNIR: spectra and imaging; SWIR: spectra) may be the major factor driving the inconsistency between the Str_OL/(Str_OL+Str_CPX1+Str_OPX1) ratio and the values acquired from ASD spectra, which affect the predicted CPX/(CPX+OPX) ratios. It is therefore import to build suitable models for the interpretation of the spectra acquired by the CE-4 VNIS payload using the dataset obtained by the VNIS EM.
4.2 SIM results of VNIS EM spectra
The spectral indices of the VNIS EM are listed in Table B.3. The CPX/(CPX+OPX) values linearly increase with the corresponding spectral index ratios (Fig. 3a), with an R-square of 0.92, which can be expressed as follows:
 (4)
(4)
The predicted CPX/(CPX+OPX) values (Table B.3) using the leave-one-out cross-validation (LOOCV) method are similar to the actual values (Fig. 3b). All scattered plots lie along the 1:1 line within two dashed lines of ±3%, and the root mean square error (RMSE) is 4.20, indicating a good correlation between the predicted and actual values. Equation (4) can be applied to constrain the relative abundance of CPX and OPX at the CE-4 landing site based on the spectra acquired by the CE-4 VNIS payload.
The IBDR values tended to increase with increasing OL volume fractions in mafic minerals (OL/(OL+CPX+OPX)), as shown in Fig. 3c, which can be expressed as follows:
 (5)
(5)
where the IBDR is calculated using Eq. (3). The predicted OL/(OL+CPX+OPX) values of the samples were derived using the LOOCV algorithm. Scattered plots of predicted and actual OL/(OL+CPX+OPX) values shown in Fig. 3d lie along the 1:1 line with an RMSE of 18.65. The performance of this model was better (RMSE = 16.33) for samples with an IBDR of greater than 80% or predicted values of greater than 10 vol.%. Hence, this method cannot obtain accurate OL volume fractions in mafic minerals but can be applied to qualitatively constrain OL content at the CE-4 landing site.
4.3 MGM results of VNIS EM spectra
The absorption parameters including band center (BC), strength (Str), and full width at half maximum (FWHM) of spectral features of CPX, OPX, and OL were derived from their continuum-removed spectra acquired by the VNIS EM using MGM deconvolution. For lunar rocks with an IBDR of greater than 10%, the MGM results with the OPX-CPX-OL configuration are given in Table B.4.
The BCs of OL derived with MGM linearly move to longer wavelengths with lower forsterite numbers (Fo = Mg/(Mg+Fe) molar ratio) due to substitution of Mg2+ (radius of 0.72 Å) with larger Fe2+ (radius of 0.77 Å) (Sunshine & Pieters 1998). The fitted M2 band (~1050 nm) of OL is difficult to determine by MGM deconvolution because of the strong absorption features of pyroxene (Sunshine & Pieters 1998; Varatharajan et al. 2014; Ling et al. 2015). The fitted M1 bands occur at 831–852 nm and 1185–1222 nm, suggesting a Mg-rich composition (average Fo89.17, Fig. B.3), which is consistent with the XRF (Fo89.24) and Raman results (Fo87.8).
The Str fraction of OL at approximately 850, 1050, and 1250 nm (Str_OL/(Str_OL+Str_CPX1+Str_OPX1)×100) increases with increasing OL volume fractions in mafic minerals for samples containing OL at more than 20 vol.% (Fig. 4a). OL volume fractions in mafic minerals can be predicted based on Str fractions at approximately 850, 1050, and 1250 nm as follows:
 (6)
(6)
where Str_CPX1 and Str_ OPX1 represent the Str of CPX and OPX at ~1000 nm, respectively.
The scattered points of actual and predicted OL/(OL+CPX+OPX) values using the LOOCV method lie along the 1:1 line (Fig. 4d). This model is applicable to mixtures with an OL of more than 20 vol.% (No. 1, 5, 7, 9 in Table B.4) with RMSE of 4.89. For other samples, the absorption features of OL were significantly affected by pyroxene, which diminishes the accuracy of the model (RMSE = 8.07). Therefore, OL should not be considered in samples with an OL of lower than 20 vol.% (No. 2, 3, 4, 6, 8), and results derived from MGM deconvolution with OPX-CPX configuration are given in Table B.5.
The Str fractions of CPX in pyroxene appear to vary linearly with the volume percentage of CPX (Tables B.4 and B.5, Fig. 4c), which could be quantified by the Str fractions of CPX as follows:
 (7)
(7)
where Str_CPX1 and Str_ OPX1 represent the Str of CPX at ~1000 nm and ~2000 nm, respectively. The predicted CPX/(CPX+OPX) derived using the LOOCV algorithm and the actual values are shown in Fig. 4d. All scatter plots lie along the 1:1 line within the two dashed lines of ±10%, indicating a good correlation (R2 = 0.96, RMSE = 3.16). The equation provides a method for estimating the CPX volume fractions in pyroxene based on the MGM deconvolution of spectra acquired by the CE-4 VNIS payload.
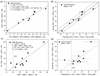 |
Fig. 3 Results of SIM models using VNIS EM spectra. (a) Scattered plots of the actual CPX/(CPX+OPX) values and the corresponding index values obtained using the SIM. (b) Comparison of the actual and predicted CPX/(CPX+OPX) using the LOOCV method. (c) Scatter plots of the OL/(OL+CPX+OPX) ratios and IBD1/(IBD1+IBD2) acquired using the SIM. (d) Comparison of actual and predicted OL/(OL+CPX+OPX) values using the LOOCV method. |
5 Applications on CE-4 spectral analysis
5.1 Mineralogy of lunar rocks and regolith
The volume fractions of CPX and OL derived using the SIM algorithm (Eqs. (4) and (5)) using the spectra acquired by the VNIS payload on the Moon are given in Table B.6 and Figs. 5a–b. The predicted OL volume fractions lower than zero indicate a low OL content, and these values were replaced by zero. CPX/(OL+CPX+OPX) values shown in Table B.6 were obtained based on the predicted results of CPX/(CPX+OPX) and OL/(OL+CPX+OPX).
The CPX/(CPX+OPX) and OL/(OL+CPX+OPX) values in the same region of lunar soil and rocks where several VNIR spectra have been obtained (i.e., regions of two photometric experiments, Region 2 and Region 3 of Lunar Rock 2, as well as Region 2 of Lunar Rock 4) remain constant in the error range of Eq. (4) (RMSE = 4.24) and Eq. (5) (RMSE = 16.33). For example, the CPX/(CPX+OPX) and OL/(OL+CPX+OPX) values of lunar soil in Photometric Experiment 2 were 66–69 vol.% and 0–20 vol.% based on 12 VNIR spectra in different viewing geometries, indicating a steady evaluation of mafic mineral fractions in mixtures.
The lunar rocks and regolith at the CE-4 landing site are CPX-rich and poor in OL (CPX:OPX:OL = 56:29:17). Lunar Rock 2 exhibits mineralogy inhomogeneity of OL content in different regions (Region 1 and Region 2: 0 vol.%; Region 3: ~30 vol.%). The mineralogical features of Lunar Rocks 2–4 are similar to those of lunar regolith, indicating their similar origins. Nevertheless, Lunar Rock 1 had a lower CPX content (CPX: 55 ± 4 vol.%; OPX: 45 ± 4 vol.%) compared with other rocks and surrounding lunar regolith, which may provide evidence that Rock 1 has a different geological origin.
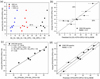 |
Fig. 4 Results of MGM models using VNIS EM spectra. (a) Scatter plots of actual OL/(OL+CPX+OPX) values and Str_OL/(Str_OL+Str_CPX1+Str_OPX1) obtained using MGM with VNIS EM spectra. (b) Comparison of actual and predicted OL/(OL+CPX+OPX) using the LOOCV algorithm. (c) Scatter plots of CPX/(CPX+OPX) and corresponding Str from MGM with VNIS EM spectra. (d) Comparison of actual and predicted CPX/(CPX+OPX) values using the LOOCV algorithm. |
5.2 Mineral compositions of lunar rocks at the CE-4 landing site
MGM deconvolution was conducted for the CE-4 spectra of the four lunar rocks. For Region 1 and Region 2 of Lunar Rock 2, the OL content is not considered because of the extremely low OL according to the results of the SIM algorithm (shown in Table B.6). For other lunar rock spectra, two MGM configurations (OPX-CPX and OPX-CPX-OL) were carried out, and theresults are given in Tables 1 and 2, respectively. The predicted OL volume fractions in Lunar Rocks 1, 2, and 4 were more than 20 vol.% based on the MGM algorithm (Fig. 6b), indicating acceptable prediction results of Eq. (6).
The BCs of OPX and CPX in lunar rocks acquired by the MGM deconvolution method are plotted in Fig. 5c and compared with those obtained by Adams (1974), Cloutis & Gaffey (1991), and Moriarty & Pieters (2018). The results of MGM with OPX-CPX-OL and OPX-CPX configurations exhibited similar BCs. The OPX of these lunar rocks contains more Fe than the OPX samples from Adams (1974) and Cloutis & Gaffey (1991), and more Mg than OPX samples from Moriarty & Pieters (2018). In addition, OPX exhibits mid-Mg characteristics based on the results of Klima et al. (2011). The CPX of four lunar rocks exhibits relatively mid-Ca and Fe contents compared with HC-CPX and LC-CPX from Moriarty & Pieters (2018). For OL, the Fo values and BCs derived from MGM are given in Fig. 5d, indicating that OL in lunar rocks exhibits mid-Mg content (Fo60−79).
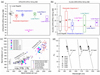 |
Fig. 5 Mineralogy and compositions of materials at the CE-4 landing site. (a) CPX volume fractions in pyroxene and (b) OL volume fractions in mafic minerals using the SIM algorithm. (c) Band centers of the pyroxene and (d) Fo values of OL derived using the MGM algorithm. |
5.3 Comparison of CE-4 mineralogy from different models
The mineral contents of the four lunar rocks obtained by the SIM algorithm were compared with the results of the MGM deconvolution algorithm (Fig. 6). The CPX/(CPX+OPX) derived using MGM with the OPX-CPX configuration (Table 1) was comparable to the results of the OPX-CPX-OL pattern (Table 2). All scattered points of CPX/(CPX+OPX) acquired using the SIM and MGM algorithms lie along the 1:1 line considering the RMSE values, and the OL contents predicted by the SIM algorithm increase linearly with the results of the MGM. However, the OL contents obtained by MGM were slightly higher than those obtained by the SIM algorithm. This may be caused by the fact that the absorption feature at ~1200 nm is neglected for mid-to-high Fe-pyroxene (Klima et al. 2007, 2011), which is difficult to consider for the OPX-CPX-OL configuration of the MGM deconvolution algorithm. Thus, the results of CPX/(CPX+OPX) and OL/(OL+CPX+OPX) predicted by the SIM algorithm are comparable with the MGM results, indicating a reliable prediction by models built by SIM, and that SIM can better constrain the mineralogy assemblages (as shown in Figs. 5 a–b) for the spectra acquired by the CE-4 VNIS payload.
5.4 Geologic interpretation
The pyroxenes in the CE-4 rocks and regolith are dominated by CPX (55–73 vol.% in Table B.6), which is consistent with the higher CPX/OPX values (intensity ratios of 0.77–1.99 or CPX volume fractios of 41–83 vol.% based on Eq. (7)) exposed in the wall and ejecta blanket of the Finsen crater (Ling et al. 2019; Qiao et al. 2019; Fu et al. 2020; Guo et al. 2021). Lunar Rock 1 had a lower CPX (~55 vol.%) than other rocks and regolith (62–73 vol.%), which may be formed in a lower stratum with smaller CPX/OPX ratios exposed by the Finsen crater (Ling et al. 2019; Qiao et al. 2019; Guo et al. 2021). The lunar regolith around the CE-4 landing site exhibits mid-Ca-Fe pyroxene, and mid-Mg OL compositions, which is consistent with the mineral compositions at the Finsen crater wall in SPACA, indicating that these materials originate from the upper stratum of the SPA basin with intermediate mineral compositions (Moriarty & Pieters 2018; Moriarty et al. 2020).
The relative intensity of the absorption features at ~1200 nm for pyroxene and ~2200 nm for CPX (M1 intensity ratio) is a critical indicator of the crystallization temperature of pyroxene (Klima et al. 2008). The M1 intensity ratio values are defined as Str1200 nm/Str1200 nm+Str_OPX2+Str_OPX2, where Str values are derived from the MGM deconvolution algorithm with the OPX-CPX configuration (Table 1). The absorption features of both OPX and CPX were considered because of their similar energy of M1 absorption at ~1200 nm. The M1 intensity ratio values are 0.25–0.29 for Region 1 and Region 2 of Lunar Rock 2, which have a low OL content and thus a negligible effect from the OL feature at ~1250 nm.
The M1 intensity ratio values of CE-4 VNIS spectra for Lunar rock 2 are 0.25–0.29, which are slightly higher than the intensity ratio of HED meteorites (0.14–0.26) and synthetic OPX No. 004 crystallized from 980 °C, but lower than that of synthetic CPX No. 011 (0.31) (Klima et al. 2007, 2008), indicating that the pyroxenes in lunar rocks are crystallized at a high temperature (980–1300 °C) and are cooled quickly, which is consistent with the mid-Ca and mid-Fe content in pyroxenes of CE-4 rocks (Lindsley 1983). Hence, the lunar rocks at the CE-4 landing site may have crystallized in a high-temperature and rapid-cooling magmatic system caused by impact melt differentiation or volcanic resurfacing processes in the SPA basin (Moriarty & Pieters 2018; Moriarty et al. 2020) before being ejected by the Finsen impact event. The unique pyroxene mineral compositions and mafic mineral proportions are critical for constraining the mineral compositions in SPACA and provide important clues for evaluation of the geologic evolution of the inner SPA basin after the huge impact event.
MGM results with OPX-CPX configuration of lunar rocks at the CE-4 landing site.
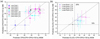 |
Fig. 6 Comparison of predicted CPX/(CPX+OPX) and OL/(OL+CPX+OPX) by SIM and MGM methods. |
MGM results with OPX-CPX-OL configuration of lunar rocks at the CE-4 landing site.
6 Conclusions
In this study, the VNIR spectra of nine lunar analog samples were obtained using the VNIS EM. Four models to predict the CPX/(CPX+OPX) and OL/(OL+CPX+OPX) of mafic minerals were proposed using SIM and MGM algorithms and were applied to VNIR spectra obtained by CE-4 VNIS payload on the lunar farside surface. In addition, we suggest the use of a threshold of 20 vol.% of OL content in mafic minerals when using the MGM deconvolution algorithm with the OPX-CPX-OL configuration.
The mineralogy of lunar rocks and regolith at the CE-4 landing site is rich in CPX with a low abundance of OL (CPX:OPX:OL = 56:29:17). The four lunar rocks are composed of mid-Ca-Fe pyroxene, and mid-Mg OL contents, providing critical constraints for mineral compositions in SPACA. The lower CPX fraction of Lunar Rock 1 suggests that it may come from a lower stratum exposed by the Finsen crater than other rocks and regolith. The high M1 intensity ratio values imply that the lunar rocks at the CE-4 landing site may have been crystallized in a high temperature (980–1300 °C) and rapid-cooling magmatic system produced by impact melt differentiation or volcanic resurfacing events in the SPA basin before subsequent excavation by the Finsen impact.
Acknowledgements
The Chang’E?4 mission was carried out by the Chinese Lunar Exploration Program, and the scientific data are provided by China National Space Administration. This work is supported by National Natural Science Foundation of China (11941001, 41972322, U1931211), the Strategic Priority Research Program of Chinese Academy of Sciences (XDB 41000000), the National Key Research and Development Program of China (2020YFE0202100, 2019YFE0123300), the Pre-research project on Civil Aerospace Technologies (Nos. D020102 and D020201) funded by China National Space Administration (CNSA), the Natural Science Foundation of Shandong Province (ZR2019MD008), China Postdoctoral Science Foundation (2020M682164), and Physical-Chemical Materials Analytical and Testing Center of Shandong University at Weihai. The CE-4 spectral database reported in this work is available at https://moon.bao.ac.cn/ce5web/searchOrder_dataSearchData.search. The experimental and simulation data are available at https://pds.wh.sdu.edu.cn/English/Data_PDS_Service/Publication_Data_Share.htm. This is the SDU-CPS publication #88.
Appendix A VNIR spectra measurements
VNIR reflectance spectra in 450–2395 nm were obtained using CE-4 VNIS EM, which is a copy of the VNIS payload aboard the Yutu-2 rover. Powder samples were laid on a disk with a volume of 12 cm by× 16 cm by× 5 mm. An 800 W tungsten halogen lamp was selected as a light source, and the distance between the lamp and the sample dish was fixed at ~0.7 m, which is similar to the parameters of the VNIS payload aboard Yutu-2. The incident and emission angles were fixed at 60° and 45°, respectively, according tothe average solar incident angles and emission angles of the VNIS measurements on the lunar surface. A phase angle of 90° (azimuth angle of 55°) was selectedin this study based on actual measurements by the VNIS payload. The spectrometer was calibrated by an approximately reflecting Lambertian surface (SRT-99-100) from Spectralon before each measurement. The relative reflectance was converted into absolute reflectance by multiplying the absolute reflectance of SRT-99-100.
To evaluate the instrumental effects and spectral properties of VNIS, we also acquired absolute reflectance spectra of the same lunar soil analogs at 350–2500 nm using a FieldSpec 4 Hi-Res VNIR spectrometer (Analytical Spectral Devices, Inc.) coupled with an 8° field of view (Unit 18380) at the same viewing geometry as CE-4 VNIS EM (i = 60°, e = 45°, g = 90°). A 75 W ASD illuminator lamp was selected as the light source. Powder samples were filled in a ~55 mm diameter culture dish to avoid additional inaccuracy caused by the varying distance between the ASD fiber and the sample surface. Spectra from three locations were acquired to account for the heterogeneity of the samples. In total, 100 scans were performed at each location to avoid possible instability of the instrument. Before each measurement, the spectrometer was calibrated using an approximately reflecting Lambertian surface (SRS-99-010) from Labsphere.
Appendix B Chemical and mineralogical characterization
The elemental compositions of nine lunar soil analogs and end members (shown in Table B.2) were measured using an ARL Perfom’X 4200 X-ray fluorescence (XRF) spectrometer at the State Key Laboratory of Ore Deposit Geochemistry, Institute of Geochemistry, Chinese Academy of Sciences. The mineralogical information of the four end members was characterized using Raman spectroscopy (100–1400 cm−1) using an inVia Raman System (Renishaw Company) at a spectral resolution better than 1 cm−1. The purity of the end members was ensured using a 20-point laser Raman point-counting technique. Raman peak positions of end members were acquired by the spectral deconvolution method using a mixed Gaussian–Lorentzian algorithm.
The Raman spectral profile and peak positions provide information on mineral composition (Wang et al. 2001). “Quadrilateral” pyroxenes [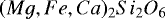 ], primarily defined within the compositional space bounded by enstatite, ferrosilite, diopside, and hedenbergite (Lucey 2004), with the Raman shift at ~320 cm−1 commonly referred as crystal lattice modes (peak 1), ~670 cm−1 (peak 2) caused by bridging oxygen stretch in the Si-Ob-Si bond of the [Si2 O6]4− unit, and ~1000 cm−1 attributed to Si − Onb bond stretching in the [SiO4]4− unit (Wang et al. 2001) (Fig. B.4a). Olivine has two major Raman peaks at ~820 cm−1 and ~850 cm−1, which are attributed to the internal stretching vibrational modes of the [SiO4]4− units (Fig. B.4c).
The mineral compositions of pyroxene (Wo=Ca/(Mg+Fe+Ca), Fs=Fe/(Mg+Fe+Ca), En=Mg/(Mg+Fe+Ca) and Fo of OL were calculated using their Raman peak positions based on the equations described by Wang et al. (2001) and Kuebler et al. (2006). Hypersthene and augite exhibited high Mg and Fe contents (Fig. B.4b), and an obvious boundary (~30 vol.%) of Ca content. The average composition of augite (Wo38Fs12En49) was similar to that of the XRF result (Wo38Fs17En45). The different compositions of hypersthene acquired by Raman (Wo15Fs18En67) and XRF (Wo26Fs22En51) could be attributed to different detection areas and a small amount of mineral for both techniques. OL is Mg-rich with an average Fo of 87.8 (Fig. B.4d), which is consistent with the XRF results (Fo89.2). Moreover, the peak positions (Peak 1 and Peak 2) of OL systematically shifted to higher wavenumbers with increasing Fo values.
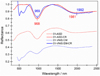 |
Fig. B.1 Comparison of the spectra of No.01 mixture acquired by ASD and VNIS EM. |
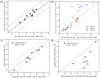 |
Fig. B.2 Comparison of the Str_CPX/(Str_CPX+Str_OPX (a) and Str_OL/(Str_OL+Str_CPX1+Str_OPX1 (b) derived from MGM algorithm using spectra acquired by ASD and VNIS EM, and the predicted CPX/(CPX+OPX) (c) and OL/(OL+CPX+OPX) using the spectra of VNIS EM by the MGM model built using the ASD spectra. |
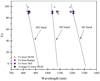 |
Fig. B.3 Band centers of the three primary 1 μm olivine features. The solid lines represent the correlation between band centers and Fo values from Sunshine & Pieters (1998). |
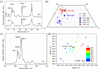 |
Fig. B.4 (a) Raman spectra and peak positions of augite and hypersthene. (b) En-Di-Hd-Fs (Enstatite-Diopside-Hedenbergite-Ferrosilite) quadrilateral composition of hypersthene (red) and augite (blue). (c) Representative Raman spectra of olivine. (d) Variations of Peak1 and Peak2 position with Fo of olivine. |
Mineral volume fractions in lunar soil analogs studied in this work.
Composition of lunar soil analog mineral mixtures from XRF.
Spectral indices and predicted volume fractions of CPX and OL using the LOOCV algorithm.
MGM results with OPX-CPX-OL configuration using continuum-removed spectra acquired by CE-4 VNIS EM.
The MGM results with OPX-CPX configuration for samples with OL less than 20 vol.% based on continuum-removed spectra acquired by the CE-4 VNIS EM.
CPX, OPX and OL volume fractions using SIM algorithm based on continuum-removed spectra acquired by CE-4 VNIS payload.
References
- Adams, J. B. 1974, J. Geophys. Res., 79, 4829 [NASA ADS] [CrossRef] [Google Scholar]
- Chen, J., Ling, Z., Qiao, L., et al. 2020, Sci. China Inf. Sci., 63, 1 [Google Scholar]
- Cloutis, E. A., & Gaffey, M. J. 1991, J. Geophys. Res. Planets, 96, 22809 [Google Scholar]
- Cloutis, E. A., Gaffey, M. J., Jackowski, T. L., & Reed, K. L. 1986, J. Geophys. Res. Solid Earth, 91, 11641 [CrossRef] [Google Scholar]
- Di, K., Liu, Z., Liu, B., et al. 2019, J. Remote. Sens., 23, 177 [Google Scholar]
- Fu, X. H., Qiao, L., Zhang, J., Ling, Z. C., & Li, B. 2020, Res. Astron. Astrophys., 20, 008 [CrossRef] [Google Scholar]
- Gou, S., Di, K., Yue, Z., et al. 2020, Icarus, 345, 113776 [CrossRef] [Google Scholar]
- Guo, D., Fa, W., Zeng, X., Du, J., & Liu, J. 2021, Icarus, 359, 114327 [CrossRef] [Google Scholar]
- Gueymard, C. A. 2004, Sol. Energy, 76, 423 [NASA ADS] [CrossRef] [Google Scholar]
- Hapke, B., 2012, Theory of Reflectance and Emittance Spectroscopy (Cambridge: Cambridge university press) [Google Scholar]
- He, Z., Li, C., Xu, R., et al. 2019, J. Appl. Remote. Sens., 13, 027502 [NASA ADS] [CrossRef] [Google Scholar]
- Horgan, B. H., Cloutis, E. A., Mann, P., & Bell III, J. F. 2014, Icarus, 234, 132 [NASA ADS] [CrossRef] [Google Scholar]
- Hu, X., Ma, P., Yang, Y., et al. 2019, Geophys. Res. Lett., 46, 9439 [NASA ADS] [CrossRef] [Google Scholar]
- Huang, J., Xiao, Z., Flahaut, J., et al. 2018, J. Geophys. Res. Planets, 123, 1684 [NASA ADS] [CrossRef] [Google Scholar]
- Huang, J., Xiao, Z., Xiao, L., et al. 2020, Geology, 48, 723 [NASA ADS] [CrossRef] [Google Scholar]
- Klima, R. L., Pieters, C. M., & Dyar, M. D. 2007, Meteorit Planet Sci, 42, 235 [NASA ADS] [CrossRef] [Google Scholar]
- Klima, R. L., Pieters, C. M., & Dyar, M. D. 2008, Meteorit Planet Sci, 43, 1591 [NASA ADS] [CrossRef] [Google Scholar]
- Klima, R. L., Pieters, C. M., Boardman, J. W., et al. 2011, J. Geophys. Res. Planets, 116 [Google Scholar]
- Kuebler, K. E., Jolliff, B. L., Wang, A., & Haskin, L. A. 2006, Geochim. Cosmochim. Acta, 70, 6201 [CrossRef] [Google Scholar]
- Lemelin, M. 2016, The Composition of the Lunar Crust: an in-depth Remote Sensing View (USA: University of Hawaii at Manoa) [Google Scholar]
- Lemelin, M., Lucey, P. G., Miljković, K., et al. 2019, Planet. Space Sci., 165, 230 [CrossRef] [Google Scholar]
- Li, C., Wang, Z., Xu, R., et al. 2019a, Sensors, 19, 2806 [NASA ADS] [CrossRef] [Google Scholar]
- Li, C., Xu, R., Lv, G., et al. 2019b, Rev. Sci. Instrum., 90, 103106 [NASA ADS] [CrossRef] [Google Scholar]
- Li, C., Liu, D., Liu, B., et al. 2019c, Nature, 569, 378 [NASA ADS] [CrossRef] [Google Scholar]
- Lin, H., He, Z., Yang, W., et al. 2020, Natl. Sci. Rev., 7, 913 [CrossRef] [Google Scholar]
- Lindsley, D. H. 1983, Am. Mineral., 68, 477 [Google Scholar]
- Ling, Z., Jolliff, B. L., Wang, A., et al. 2015, Nat. Commun., 6, 1 [CrossRef] [Google Scholar]
- Ling, Z., Qiao,L., Liu, C., et al. 2019, Planet. Space Sci., 179, 104741 [NASA ADS] [CrossRef] [Google Scholar]
- Liu, J., Ren, X., Yan, W., et al. 2019, Nat. Commun., 10, 1 [NASA ADS] [CrossRef] [Google Scholar]
- Lucey, P. G. 2004, Geophys. Res. Lett., 31, L08701 [NASA ADS] [CrossRef] [Google Scholar]
- Martinot, M., Besse, S., & Flahaut, J. 2018, J. Geophys. Res. Planets, 123, 612 [NASA ADS] [CrossRef] [Google Scholar]
- Moriarty, D., & Pieters, C., 2018, J. Geophys. Res. Planets, 123, 729 [NASA ADS] [CrossRef] [Google Scholar]
- Moriarty, D., Watkins, R., Valencia, S., et al. 2020, J. Geophys. Res. Planets, e2020JE006589 [Google Scholar]
- Mustard, J. F., Pieters, C. M., Isaacson, P. J., et al. 2011, J. Geophys. Res. Planets, 116, E00G12 [CrossRef] [Google Scholar]
- Qi, X., Ling, Z., Zhang, J., et al. 2020, Remote Sens., 12, 3211 [NASA ADS] [CrossRef] [Google Scholar]
- Qiao, L., Ling, Z., Fu, X., & Li, B. 2019, Icarus, 333, 37 [CrossRef] [Google Scholar]
- Savitzky, A., & Golay, M. J. 1964, Anal. Chem., 36, 1627 [NASA ADS] [CrossRef] [Google Scholar]
- Staid, M. I., Pieters, C. M., Besse, S., et al. 2011, J. Geophys. Res. Planets, 116, E00G10 [CrossRef] [Google Scholar]
- Sunshine, J. M., & Pieters, C. M. 1998, J. Geophys. Res. Planets, 103, 13675 [NASA ADS] [CrossRef] [Google Scholar]
- Sunshine, J. M., Pieters, C. M., & Pratt, S. F. 1990, J. Geophys. Res. Planets, 95, 6955 [NASA ADS] [CrossRef] [Google Scholar]
- Varatharajan, I., Srivastava, N., & Murty, S. V. S. 2014, Icarus, 236, 56 [NASA ADS] [CrossRef] [Google Scholar]
- Wang, A., Jolliff, B. L., Haskin, L. A., Kuebler, K. E., & Viskupic, K. M. 2001, Am. Mineral., 86, 790 [NASA ADS] [CrossRef] [Google Scholar]
- Wilhelms, D. E., Howard, K. A., & Wilshire, H. G. 1979, Geologic map of the south side of the Moon (Department of the Interior, US Geological Survey) [Google Scholar]
- Wu, W., Li, C., & Zuo, W. 2019, Nat. Geosci., 12, 222 [NASA ADS] [CrossRef] [Google Scholar]
All Tables
MGM results with OPX-CPX-OL configuration of lunar rocks at the CE-4 landing site.
Spectral indices and predicted volume fractions of CPX and OL using the LOOCV algorithm.
MGM results with OPX-CPX-OL configuration using continuum-removed spectra acquired by CE-4 VNIS EM.
The MGM results with OPX-CPX configuration for samples with OL less than 20 vol.% based on continuum-removed spectra acquired by the CE-4 VNIS EM.
CPX, OPX and OL volume fractions using SIM algorithm based on continuum-removed spectra acquired by CE-4 VNIS payload.
All Figures
|
Fig. 1 CMOS images of lunar rocks and regolith observed by the Yutu-2 rover. |
| In the text | |
|
Fig. 2 (a−b) Reflectance spectra before and after continuum removal acquired by VNIS Engineering Model and CE-4 VNIS payload. (c− d) VNIR spectra of CE-4 lunar rocks before and after continuum removal. |
| In the text | |
|
Fig. 3 Results of SIM models using VNIS EM spectra. (a) Scattered plots of the actual CPX/(CPX+OPX) values and the corresponding index values obtained using the SIM. (b) Comparison of the actual and predicted CPX/(CPX+OPX) using the LOOCV method. (c) Scatter plots of the OL/(OL+CPX+OPX) ratios and IBD1/(IBD1+IBD2) acquired using the SIM. (d) Comparison of actual and predicted OL/(OL+CPX+OPX) values using the LOOCV method. |
| In the text | |
|
Fig. 4 Results of MGM models using VNIS EM spectra. (a) Scatter plots of actual OL/(OL+CPX+OPX) values and Str_OL/(Str_OL+Str_CPX1+Str_OPX1) obtained using MGM with VNIS EM spectra. (b) Comparison of actual and predicted OL/(OL+CPX+OPX) using the LOOCV algorithm. (c) Scatter plots of CPX/(CPX+OPX) and corresponding Str from MGM with VNIS EM spectra. (d) Comparison of actual and predicted CPX/(CPX+OPX) values using the LOOCV algorithm. |
| In the text | |
|
Fig. 5 Mineralogy and compositions of materials at the CE-4 landing site. (a) CPX volume fractions in pyroxene and (b) OL volume fractions in mafic minerals using the SIM algorithm. (c) Band centers of the pyroxene and (d) Fo values of OL derived using the MGM algorithm. |
| In the text | |
|
Fig. 6 Comparison of predicted CPX/(CPX+OPX) and OL/(OL+CPX+OPX) by SIM and MGM methods. |
| In the text | |
|
Fig. B.1 Comparison of the spectra of No.01 mixture acquired by ASD and VNIS EM. |
| In the text | |
|
Fig. B.2 Comparison of the Str_CPX/(Str_CPX+Str_OPX (a) and Str_OL/(Str_OL+Str_CPX1+Str_OPX1 (b) derived from MGM algorithm using spectra acquired by ASD and VNIS EM, and the predicted CPX/(CPX+OPX) (c) and OL/(OL+CPX+OPX) using the spectra of VNIS EM by the MGM model built using the ASD spectra. |
| In the text | |
|
Fig. B.3 Band centers of the three primary 1 μm olivine features. The solid lines represent the correlation between band centers and Fo values from Sunshine & Pieters (1998). |
| In the text | |
|
Fig. B.4 (a) Raman spectra and peak positions of augite and hypersthene. (b) En-Di-Hd-Fs (Enstatite-Diopside-Hedenbergite-Ferrosilite) quadrilateral composition of hypersthene (red) and augite (blue). (c) Representative Raman spectra of olivine. (d) Variations of Peak1 and Peak2 position with Fo of olivine. |
| In the text | |
Current usage metrics show cumulative count of Article Views (full-text article views including HTML views, PDF and ePub downloads, according to the available data) and Abstracts Views on Vision4Press platform.
Data correspond to usage on the plateform after 2015. The current usage metrics is available 48-96 hours after online publication and is updated daily on week days.
Initial download of the metrics may take a while.