Fig. 3
Download original image
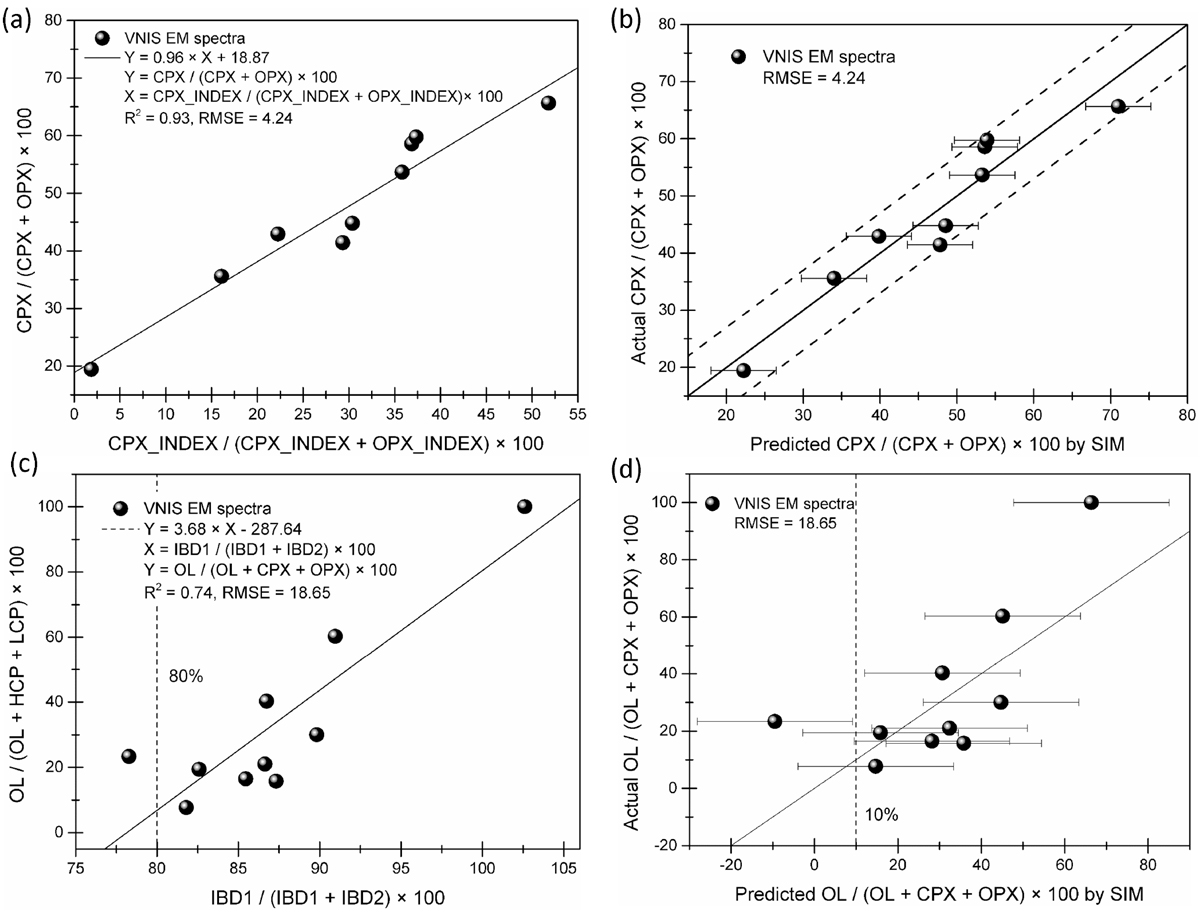
Results of SIM models using VNIS EM spectra. (a) Scattered plots of the actual CPX/(CPX+OPX) values and the corresponding index values obtained using the SIM. (b) Comparison of the actual and predicted CPX/(CPX+OPX) using the LOOCV method. (c) Scatter plots of the OL/(OL+CPX+OPX) ratios and IBD1/(IBD1+IBD2) acquired using the SIM. (d) Comparison of actual and predicted OL/(OL+CPX+OPX) values using the LOOCV method.
Current usage metrics show cumulative count of Article Views (full-text article views including HTML views, PDF and ePub downloads, according to the available data) and Abstracts Views on Vision4Press platform.
Data correspond to usage on the plateform after 2015. The current usage metrics is available 48-96 hours after online publication and is updated daily on week days.
Initial download of the metrics may take a while.