Fig. 2
Download original image
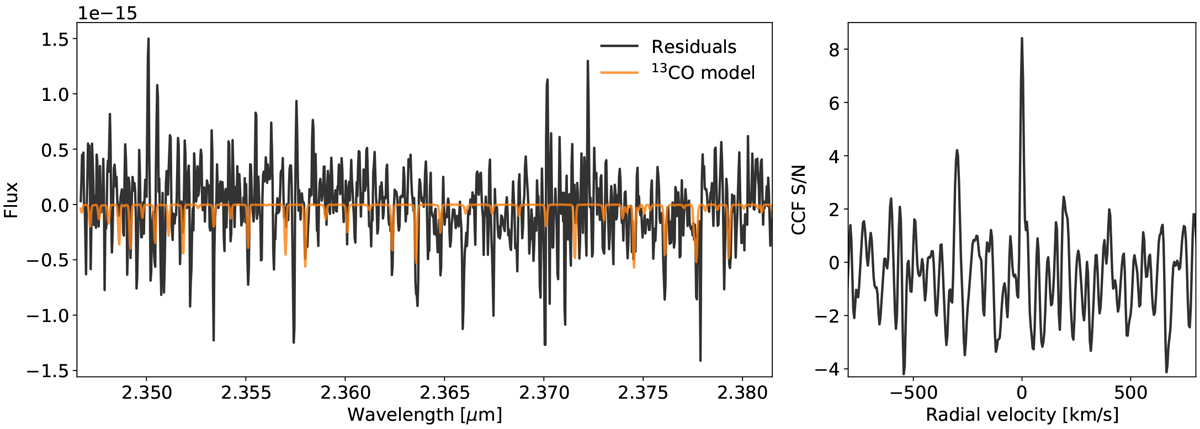
Left panel: observational residuals (observed spectrum minus best-fit model with the 13CO abundance set to zero) in black and 13CO model spectrum given the best-fit 12CO/13CO ratio (~97) in orange. Right panel: cross-correlation function (CCF) between the 13CO model and residuals. The CCF is normalised by its standard deviation within the velocity ranges [−2200, −800] and [800, 2200] km s−1, so that the y-axis represents the signal-to-noise of the CCF peak.
Current usage metrics show cumulative count of Article Views (full-text article views including HTML views, PDF and ePub downloads, according to the available data) and Abstracts Views on Vision4Press platform.
Data correspond to usage on the plateform after 2015. The current usage metrics is available 48-96 hours after online publication and is updated daily on week days.
Initial download of the metrics may take a while.