| Issue |
A&A
Volume 655, November 2021
|
|
|---|---|---|
| Article Number | A100 | |
| Number of page(s) | 8 | |
| Section | Interstellar and circumstellar matter | |
| DOI | https://doi.org/10.1051/0004-6361/202142297 | |
| Published online | 01 December 2021 | |
The mid-infrared environment of the stellar merger remnant V838 Monocerotis
1
Nicolaus Copernicus Astronomical Center, Polish Academy of Sciences,
Rabiańska 8,
87-100
Toruń,
Poland
e-mail: This email address is being protected from spambots. You need JavaScript enabled to view it.
2
Université Côte d’Azur, Observatoire de la Côte d’Azur, CNRS,
Laboratoire Lagrange,
France
3
European Southern Observatory,
Karl-Schwarzschild-Str. 2,
85748
Garching bei Munchen,
Germany
4
European Southern Observatory,
Alonso de Cordoba 3107,
Vitacura,
Santiago,
Chile
Received:
16
September
2021
Accepted:
28
October
2021
Abstract
Context. In 2002, V838 Monocerotis (V838 Mon) erupted in a red nova event that has been interpreted as being a stellar merger. Soon after reaching peak luminosity, it began to cool and its spectrum evolved to later spectral types. Dust was also formed in the post-merger remnant, making it bright in the mid-infrared. Interferometric studies at these wavelengths have suggested the presence of a flattened elongated structure.
Aims. We investigate, for the first time, the structure and orientation of the dusty envelope surrounding V838 Mon in the L band (2.8–4.2 μm) using recent observations with the MATISSE instrument at the VLTI.
Methods. We perform simple geometrical modeling of the interferometric observables using basic models (disks, Gaussians, and point sources, along with their combinations). We also reconstructed an image and analyzed the corresponding L-band spectrum.
Results. This study indicates the presence of an elongated, disk-like structure near 3.5 μm, similar to what has been observed in other wavelength regimes. In particular, the orientation at a position angle of –40° agrees with prior measurements in other bands.
Conclusions. The dusty elongated structure surrounding V838 Mon appears to be a stable and long-lived feature that has been present in the system for over a decade. Its substructure and origin remain unclear but may be related to mass loss phenomena that took place in the orbital plane of the merged binary.
Key words: instrumentation: interferometers / techniques: interferometric / stars: individual: V838 Monocerotis / circumstellar matter
© ESO 2021
1 Introduction
In early 2002, V838 Monocerotis (V838 Mon) erupted in a red nova event (Munari et al. 2002b; Tylenda 2005). On timescales of a few weeks, it increased its luminosity by over two orders of magnitude, reaching a peak luminosity of 106 L⊙ (Tylenda 2005; Sparks et al. 2008). The main mechanism behind this event is thought to be the merger of an 8 M⊙ main sequence star with a 0.4 M⊙ young stellar object (Tylenda & Soker 2006). Soon after the eruption, the temperature of V838 Mon decreased, and its spectra evolved to an L-type supergiant (Evans et al. 2003; Loebman et al. 2015). Spectral studies revealed the presence of a myriad of circumstellar molecules, including water and transition-metal oxides (Banerjee & Ashok 2002; Kamiński et al. 2009). Dust formation also took place in the merger ejecta (Wisniewski et al. 2008; Kamiński et al. 2021). Furthermore, a B-type companion was discovered close to V838 Mon (Munari et al. 2002a), which suggested that the merger occurred within a triple system. The companion disappeared in 2005 in the optical after becoming shrouded by the dusty ejecta produced in the 2002 eruption (Tylenda et al. 2009). V838 Mon remains a prototype of a luminous Galactic red nova, a type of transient whose analogs have been observed in the Local Group (Pastorello et al. 2019).
The stellar remnant of V838 Mon and its dusty environment have remained sufficiently bright for mid-infrared (MIR) interferometric measurements. The first such observations were done in late 2004 by Lane et al. (2005). They obtained K-band (2.2 μm) measurements of squared visibilities using the Palomar Testbed Interferometer (PTI). They were also able to constrain the angular diameter of the central star to 1.83 ± 0.06 mas. The measurements suggested an asymmetric source, but they were too sparse to define the geometry of the object. Follow-up interferometric observations were carried out by Chesneau et al. (2014) between 2011 and 2014 using two Very Large Telescope Interferometer (VLTI) instruments: the Astronomical Multi-BEam combineR (AMBER; Petrov et al. 2007) in the H and K bands and the MID-infrared Interferometric instrument (MIDI; Leinert et al. 2003) in the N band. Uniform disk fits to the AMBER data yielded a stellar diameter of 1.15 ± 0.2 mas. Based on this, the authors claimed that the photosphere had shrunk by about 40% in the span of a decade. Furthermore, their AMBER data modeling suggested an extended component (in addition to the star) with a lower limit on the full width at half maximum (FWHM) of ~20 mas. MIDI data modeling suggested further that V838 Mon is surrounded by an extended flattened structure whose major axis length changes as a function of wavelength between 25 and 70 mas in the N band. More recent interferometric observations at millimeter (mm) wavelengths with the Atacama Large Millimeter/submillimeter Array (ALMA) revealed the presence of a flattened structure with a FWHM of 17.6 × 7.6 mas in the immediate surroundings of V838 Mon (Kamiński et al. 2021). The multiwavelength measurements, from 2.2 μm to 1.3 mm, represent mainly dust emission, and they all seem to be similarly oriented, with the major axes at position angles (PAs) of –10° (MIDI) to –50° (ALMA). The observed circumstellar features could be manifestations of a single structure, such as a disk seen at an intermediate inclination. The presence of such a disk is expected in merger remnants as a reservoir of angular momentum that was previously stored in the merged binary system (e.g., Pejcha et al. 2017).
The stellar remnant of V838 Mon and its circumstellar environment are of prime interest because they directly illustrate what happens to a system years to decades after the stellar coalescence. They provide us with crucial information on the physical processes that govern mergers of non-compact stars and the recovery phase of the merger product to a stable configuration. Here, we report recent MIR interferometric observations with the VLTI that constrain the structure of the closest vicinity of the merger product 18 years after the red nova eruption and 6 years after the last VLTI observations.
2 Observations and data reduction
V838 Mon was observed with the Multi AperTure mid-Infrared SpectroScopic Experiment (MATISSE) instrument (Lopez et al. 2014), which is a four-beam interferometer at the VLTI. MATISSE observes simultaneously in the L (2.8–4.2 μm), M (4.5–5 μm), and N (8–13 μm) bands, but, due to technical limitations in 2020, the observations used in this study were taken only in the L and N bands. The source was observed in January and March 2020 with the seeing conditions indicated in Table 1. V838 Mon and a calibrator, HD 52666, were observed in the SCI-CAL1 sequence with two extended configurations (Table 1) of the 1.8 m Auxiliary Telescopes (ATs) and at a low spectral resolution (R ~ 30). On 20 January, the calibrator star could not be observed due to technical issues, and as such the night was excluded from this study.
A MATISSE observation sequence consists of a series of 12 one-minute exposures in which simultaneous interferometric and photometric data are acquired in the L band while four interferometric exposures followed by eight photometric exposures are acquired in the N band. The first series of four exposures is taken without chopping, while the following eight exposures are executed with chopping between the target and the sky. Each exposure is taken in one of four configurations of two beam commuting devices (BCDs), which switch the telescopes beams pairwise. This process helps in removing instrumental systematic effects.
We used the MATISSE pipeline version 1.5.52 to reduce our raw data. The resulting OIFITS (Duvert et al. 2017) files (version 2) contain uncalibrated interferometric observables, including six dispersed squared visibilities and three independent closure phase measurements per exposure.
The observations of V838 Mon were then calibrated using our measurements of the K5 III star, HD 52666, whose characteristics were taken from the Mid-infrared stellar Diameters and Fluxes compilation Catalog3 (MDFC; Cruzalebes et al. 2019, see Table 2). In particular, the visibility calibration was performed by dividing the raw squared visibilities of V838 Mon by those of the calibrator, corrected for its diameter (known as the interferometric transfer function). The calibrated total spectra of V838 Mon were obtained by multiplying the ratio between the target and calibrator raw fluxes measured by MATISSE at each wavelength, followed by multiplication by a model of the absolute flux of the calibrator. This model was taken from the PHOENIX stellar spectra grid as described in Husser et al. (2013).
The calibration was done for data in the L and N bands. Unfortunately, our N-band observationsof V838 Mon turned out to be of insufficient quality due to a too low source brightness at observed baselines. The N-band correlated flux is below5 Jy at all baselines, which is at the sensitivity limit for MATISSE with the ATs and is far below the expected total-power flux (~30 Jy; Kamiński et al. 2021)of the source. These data were thus excluded from our analysis. We also visually inspected the L-band squared visibilities and closure phases using the OIFITS viewer at the Jean-Marie Mariotti Center4 (JMMC). For the night of 3 January 2020, the measured squared visibilities were almost two orders of magnitude lower than those from the other nights. We compared the UV coverage of the two nights and found that they did not vary by much. Therefore, we concluded that the observations on 3 January were faulty and excluded them from the analysis as well. That left us with two observations. The UV coverages for the two observationsin the L band are shown in Fig. 1.
Given the relatively low L-band total flux of V838 Mon of about 5 Jy, only the chopped exposures provide reliable photometry and thus reliable absolute visibility measurements. Therefore we considered only the chopped exposures for the squared visibilities. We then again visually inspected the squared visibilities for each of the chopped exposures in the different BCD configurations5. This was done with the help of python scripts written by the MATISSE Consortium6. For 19 January, we found outlier values off by more than 3σ in the BCD in-in exposures. We discarded these exposures and considered only the ones with the BCD out-out configuration. For our analysis, we further restricted the data to the wavelength range 2.95–4.00 μm to exclude data points affected by telluric absorption. The calibrated squared visibilities and closure phases are shown in Fig. 3. The error bars shown there contain the short-term error that affects the individual one-minute exposures, as computed by the pipeline, and the standard deviation between the merged exposures. A calibration error associated with the stability of the L-band transfer function over a night is 2% (Lopez et al., in prep.) and was neglected in our error budget.
The nominal field of view (FoV) of our observations is ≈600 mas. For the purpose of roughly estimating the maximum angular resolution, we used the Rayleigh criterion, θ ≈ λ∕B, where B = 140 m is the size of the longest baseline. For the relevant wavelength range, we get resolutions of about 4–6 mas.
V838 Mon observation log.
Total LMN-band fluxes of V838 Mon and the calibrator.
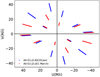 |
Fig. 1 UV plane tracks for 19 January and 1 March in the L band. |
3 Analysis
3.1 L-band spectrum
This is the first time that interferometric observations of V838 Mon have been presented in the L band. This range of the spectral energy distribution (SED) of V838 Mon is dominated by thermal emission of circumstellar dust, with negligible contribution of flux coming directly from the stellar photosphere (Kamiński et al. 2021; Woodward et al. 2021). Here, we attempt to identify the dominant spectral components in the band.
The individual flux-calibrated spectra and a weighted mean spectrum from both nights are presented in Fig. 2. Based on MIR studies of total-power spectra of the object from 2003, our spectrum should be affected by circumstellar features of SiO and H2O, and may containcontributions of photospheric bands of OH and SH (Lynch et al. 2004). We obtained opacity curves for all four molecules in pgopher7 (Western 2017). Molecular spectroscopic data were extracted from ExoMol8 (Tennyson et al. 2020) and are based on Polyansky et al. (2018) (H2O), Barton et al. (2013) (SiO), Gorman et al. (2019) (SH), and Brooke et al. (2016) (OH). The opacity curves are presented in Fig. 2. The simulations illustrate band shapes in the optically thin limit. Scaling of the bands was arbitrary as we were only interested in band identification.
Our simulations show that the spectrum can be explained by a combination of absorption of warm water in the 2ν2 band, dominant below 3.4 μm, and of SiO in its first-overtone (Δν = 1) band at around 4.1 μm. The shape of the water band suggests an excitation temperature of about 200–700 K, typical for circumstellar absorption in this source. In 2003, shortly after the outburst, SiO Δν = 1 was in emission. At the resolution of the observations, the photospheric bands of SH and OH, considered to be present in 2003 by Lynch et al. (2004), would not be discernible in the observed spectrum. In our simulations, we assumed they form at a photospheric temperature of 3500 K (cf. Kamiński et al. 2021). Indeed, in the SED model of Kamiński et al. (2021), the photospheric fluxes are negligible in the L band.
We conclude that a big part of the L-band flux is circumstellar dust emission that is not strongly affected by circumstellar absorption. The absorption is strongest near ≈3.0 μm, but even there it is not stronger than 20% of the continuum.
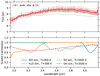 |
Fig. 2 L-band spectra of V838 Mon. The solid gray lines represent individual calibrated spectra for both nights. The red line is a weighted-mean average spectrum, with error bars representing one standard deviation in individual spectra. The bottom panel shows opacity curves for four species. They are arbitrarily scaled. All simulations were smoothed to match the resolution of the observations. SiO and H2O curves weresimulated for circumstellar gas temperatures, while SH and OH were assumed to form in photospheric temperatures. The latter two are unlikely to be present in the spectrum of V838 Mon. |
3.2 Geometric models
Due to the sparse number of points in the UV plane, we mainly analyzed the data by comparing the squared visibilities (V2) and closure phases to simple geometric models of the source. The analysis was performed using LITpro9 (Tallon-Bosc et al. 2008). LITpro allows the user to model observables with source shapes, such as a point source, a circular disk, a circular Gaussian, or their combinations. LITpro uses a χ2 minimization to find the best model and provides the reduced chi-squared,  , on the output. We simultaneously modeled the calibrated squared visibilities and closure phases. These quantities remain fairly constant with wavelengths, except at the edges of the spectral band, where the errors are very high.
We used three approaches to model the data. The resulting best-fit models are characterized in Table 3, where we provide formal fit errors from LITpro that are largely underestimated. The first approach, hereafter called A1, involved fitting a single uniform disk or a Gaussian, both either circular or elliptical, whose central position was fixed at the center of the FoV. The best fits yield the diameter in the case of disks or the FWHM for Gaussian models. All A1 results, shown in Fig. 3, imply a very small source of less than about 3 mas, comparable to our resolution at the longest baselines. Noncircular models consistently imply a small flattening of the structure (a stretch ratio of 1.4 ± 0.1) with the longer axis at a PA of ≈–40°. The elliptical models are only slightly better than the circular ones. The A1 models produce zero closure phases and thus do not reproduce the observed deviations of up to ≈ ± 5° at longer baselines.
In the second approach, A2, we attempted to represent the data with an extended component and a single point source. This was done in two ways, A2i and A2ii. In A2i, we simultaneously fitted the parameters for both components (except for the position of the extended component, which was fixed at the FoV center). In A2ii, we first fitted the extended component and then fixed the obtained parameters, added the point source, and searched for its best-fit parameters (the relative flux level and the relative x and y position). The best-fit results are shown in Figs. A.1 and A.2. The addition of a point source at an offset of 0.43–0.47 mas in A2i or 0.95–1.49 mas in A2ii northwest of the center introduces a slight asymmetry to the models, which is consistent with the observed nonzero closure phases. In A2i models, the flux of the point source dominates over the extended component. Also, the extended structure is always a few times larger in A2i than in A1. The eccentricity of the elliptical A2i models is increased with respect to A1, and the longer axis is oriented latitudinally, as illustrated graphically in Fig. 4. The A2ii approach favors models with a dominance of the extended component over the point source and with the point source at a larger offset than in A2i. The offsets are, however, very small compared to that of the companion of V838 Mon and thus could potentially represent inhomogeneities in the circumstellar dust.
The A2 models are probably already too complex to be well constrained by the limited observations in hand. However, to investigate whether there is a chance that part of the observed flux comes from the dust-enshrouded companion, we extended the A2 models by introducing a second point source. In the first form of this approach (A3i), we simultaneously fitted for all the parameters of the three components (i.e., the extended source and both point sources, with the position of the extended source fixed at the field center). A sample best-fit model of A3i is sketched in Fig. 4. In A3ii, we first fitted the data only with a disk or a Gaussian and obtained all the parameters of this component (as in A1). Then we fixed its parameters, except for the flux level and location. We next added the first point source and ran the fitting procedure to obtain relative fluxes of both components and the position of the point source. Then we added a second point source and searched for its best-fit position and the relative fluxes of the three components. Results for the A3 models are shown in Table 3 and Figs. A.3 and A.4. For the best models with two point sources, one of the points typically has an insignificant flux, of a few percent, at or below the sensitivity limit of the observations. All point sources in the A3 models are located within ≈5 mas of one another, and therefore none can represent the distant B-type companion known from ALMA maps (at a separation of 38 mas).
While the A3i models have the lowest  in Table 3, we do not consider them to be the best representation of the observed source. Their good formalfit is a consequence of many free model parameters. The simpler models, A1 and A2, are more robust and informative about the source structure given the limited data. Overall, V838 Mon observed in the L band is a slightly elongated source with an ellipticity of about 1.4 and its major axis at a PA of ≈–40°. Its longer extent is about 3.3 mas (or a FWHM of about 2.0 mas). From the A2 models we conclude that the dominant emission component may be located slightly off-center or that there is a feature northeast of the FoV center that introduces a slight asymmetry in the system. The elliptical A2i models seem to suggest an orientation of the extended component that differs from the value of –40° mentioned earlier. However, given that the point source is located along a PA of −48°, these models also suggest the same overall geometry as the noncircular models used in A1.
Fitted models and their parameters.
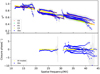 |
Fig. 3 Squared visibilities and closure phases as functions of spatial frequency for A1 models (cf. Table 3). Triangles represent the models, and the blue points represent the L-band MATISSE observables. |
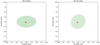 |
Fig. 4 Graphical representation of a sample of simple geometrical models. Left: A2i model for the elliptical disk and a single point source. Right: A3i model with an elliptical disk and two point sources (red circles). The transparency of the points corresponds to their relative fluxes. |
3.3 Image reconstruction
Although comprehensive imaging was not the goal of this study, due to the sparse data, we did reconstruct a single image of V838 Mon in the L band, using OImaging10 software. A model-independent image was reconstructed with the Weak-phase Interferometric Sample Alternating Reconstruction Device (WISARD), an algorithm described in Meimon et al. (2008). We fixed the FoV to 20 mas and set the image size to 64 × 64 pixels. We used the default regularization, LIL2, along with the default values for the convergence threshold and regularization scale factors. The maximum number of iterations was set to 50. The image was reconstructed using the squared visibilities and closure phases. The resulting image is shown in Fig. 5. The centroid of the main emission component is located slightly (<1 mas) off center. Several weaker structures can be seen in Fig. 5, but these are much weaker than the limit set by the dynamic range of the data and thus can be treated as artifacts.
3.4 Testing the ALMA model
Based on SED and high-resolution maps of continuum emission at 1.3 mm, Kamiński et al. (2021) constructed a 3D model of dust distribution of the entire remnant of V838 Mon. This was performed for epochs contemporary to our MATISSE observations. Their ALMA data revealed the presence of a mm-wave continuum source, component M, of a size of 17.6 × 7.6 mas, which partially aligns with the simple elongated models considered above for the L-band data. Component M was arbitrarily explained by a disk seen at moderate inclinations (~20°), but the ALMA resolution of 20 mas was still too poor to put good constraints on the form or nature of the dustystructure. Nevertheless, the MATISSE data allow us to test the model predictions for the L band. Using a ray-tracing algorithm of the RADMC-3D software (Dullemond et al. 2012), we generated a sky image of the model at 3.5 μm, which is shown in Fig. 6. It is dominated by a point source (<2 mas) surrounded by disk material, whose emission is only seen at a level of a few percent of that of the point source. We next generated squared visibilities and closure phases for this image with baselines consistent with the MATISSE observations. Their match to the MATISSE observations is, however, very poor. The model fluxes are too strongly concentrated in the point source, producing almost flat values of V2 as a function of spatial frequency. The brightness of the circumstellar material in the immediate vicinity of V838 Mon must be higher than assumed in the model of Kamiński et al. (2021).
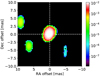 |
Fig. 5 Reconstructed image of V838 Mon in the L-band range 2.95–4 μm. The low-intensity features are imaging artifacts. The colors represent brightness in arbitrary units. |
4 Summary and discussion
The modeling attempts in Sects. 3.2 and 3.3 identified a slightly elongated source (ellipticity of about 1.4) of a size of about 3 mas, whose substructure remains unresolved. The deviation from a centro-symmetric configuration, as evident in closure phase measurements, may be the result of low-level inhomogeneities present in the dusty medium surrounding V838 Mon. The MIR observations do not show signatures of the dust-enshrouded companion of V838 Mon, which remains too faint to be observed in the L band.
Most of the considered models of the MATISSE data lead to configurations elongated at a PA of –40°. This angle is close to angles of elongation found for structures immediately surrounding V838 Mon and probed at a wide range of wavelengths (1.7 μm–1.3 mm). Their locations and orientations are schematically represented in Fig. 7. Using MIDI in the N band, Chesneau et al. (2014) found an extended dusty envelope with a size that increases with wavelength. Gaussian fits yielded FWHMs of 25 mas at 8 μm to 70 mas at 13 μm and a PA of –10° ± 30°. This PA is consistent with our result for the L-band source. Their H- and K-band data from AMBER suggested further that the N-band structure has a corresponding near-infrared (NIR) feature of a size larger than about 20 mas (but of unconstrained geometry and orientation). At the otherend of the spectrum, at mm wavelengths, Kamiński et al. (2021) found near V838 Mon an elongated dusty structure extending 18 × 8 mas and elongated at a PA of –46° ± 4°, again within the uncertainties consistent with the orientation of the L-band source. Thisclose correspondence of orientations across the spectrum can be interpreted as different manifestations of the same physical structure, perhaps a disk or torus seen at a moderate inclination. However, the sparse infrared visibilities collected so far do not allow us to make any firm conclusions. In particular, a typical circumstellar disk with a dust temperature dropping with distance should appear most extended at the longest wavelengths, which does not seem to be the case here. ALMA identified other dusty components within the remnant, some of which partially overlap with the outer structure revealed by MIDI. Since the analysis of Chesneau et al. (2014) was limited to simple geometric models, the comparison to other wavelengths may be misleading. Only full interferometric imaging at NIR and MIR wavelengths can demonstrate true associations across the spectrum and reveal the full architecture of the post-merger system.
Since the NIR and mm interferometric data on the extended dusty component span from 2011 to 2020 and all indicate virtually the same orientation, the probed structure within about 40 mas appears to have stayed relatively stable for over a decade, if not longer. Interestingly, polarimetric observations of V838 Mon in the optical showed significant linear polarization, the characteristics of which may suggest a relation to the currently observed feature. In February 2002, when the object was still in outburst, Wisniewski et al. (2003a) found that the R-band light was polarized along a PA of 151° or –29°, close to the current orientation of the L-band structure. In October 2002, that is, in the decline phase and when dust formation might have been taking place, a 90° flip in the intrinsic polarization angle was observed in the optical (Wisniewski et al. 2003b). There is no clear explanation for the flip or even for the origin of the polarized light in the different epochs, but these early observations further suggest a geometry that has remained unchanged in the immediate surroundings of V838 Mon for almost two decades. That geometry is missing in the molecular emission probed by ALMA (Kamiński et al. 2021).
It is most tempting to assume that the MIR and mm interferometric data are signatures of a circumstellar disk surrounding the recently coalesced binary. There is plenty of evidence of circumstellar disks in nearly all known or suspected post-merger systems, including V1309 Sco (Tylenda et al. 2011; Tylenda & Kamiński 2016), V4332 Sgr (Kamiński et al. 2010), and CK Vul (Kamiński et al. 2020). The disks are also predicted to form by simulations of common-envelope or merging systems and often represent material lost by the binary through the second Lagrange point (L2) into the orbital plane before the final plunge-in phase (e.g., Pejcha et al. 2016; MacLeod et al. 2018; MacLeod & Loeb 2020). If confirmed, the observed feature would then define the orientation of the orbit of the binary before its catastrophic collision. As the flattened structure potentially contains important information regarding the processes that cause stellar collisions, further infrared interferometric studies are vital and should aim to fully map the complex system of V838 Mon using model-independent imaging techniques.
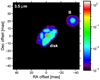 |
Fig. 6 Image of the V838 Mon model at 3.5 μm based on the SED and ALMA observations. The component seen to the northwest is related to the B-type companion. For presentation purposes, the image was smoothed to a resolution of 2 mas. Colors represent brightness in units of Jy per beam. |
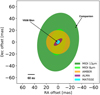 |
Fig. 7 Sketch of the multiwavelength structure of V838 Mon based on observations that span from the MIR to the mm regime. |
Acknowledgements
T.K. and M.Z.M. acknowledge funding from grant no 2018/30/E/ST9/00398 from the Polish National Science Center. Based on observations made with ESO telescopes at Paranal observatory under program ID 0104.D-0101(C). This research hasbenefited from the help of SUV, the VLTI user support service of the Jean-Marie Mariotti Center (http://www.jmmc.fr/suv.htm). This research has also made use of the JMMC’s Searchcal, LITpro, OIFitsExplorer, and Aspro services.
Appendix A More geometric models
Figures A.1 to A.4 show comparisons of the observed MATISSE quantities to best-fit models of the simple geometrical configurations considered in Sect. 3.2.
References
- Banerjee, D. P. K., & Ashok, N. M. 2002, A&A, 395, 161 [NASA ADS] [CrossRef] [EDP Sciences] [Google Scholar]
- Barton, E. J., Yurchenko, S. N., & Tennyson, J. 2013, MNRAS, 434, 1469 [NASA ADS] [CrossRef] [Google Scholar]
- Brooke, J. S., Bernath, P. F., Western, C. M., et al. 2016, J. Quant. Spectr. Rad. Transf., 168, 142 [NASA ADS] [CrossRef] [Google Scholar]
- Chesneau, O., Millour, F., De Marco, O., et al. 2014, A&A, 569, L3 [NASA ADS] [CrossRef] [EDP Sciences] [Google Scholar]
- Cruzalebes, P., Petrov, R. G. P., Robbe-Dubois, S., et al. 2019, VizieR Online Data Catalog: II/361 [Google Scholar]
- Dullemond, C. P., Juhasz, A., Pohl, A., et al. 2012, RADMC-3D: A multi-purpose radiative transfer tool, Astrophysics Source Code Library, [record ascl:1202.015] [Google Scholar]
- Duvert, G., Young, J., & Hummel, C. A. 2017, A&A, 597, A8 [NASA ADS] [CrossRef] [EDP Sciences] [Google Scholar]
- Evans, A., Geballe, T. R., Rushton, M. T., et al. 2003, MNRAS, 343, 1054 [CrossRef] [Google Scholar]
- Gorman, M. N., Yurchenko, S. N., & Tennyson, J. 2019, MNRAS, 490, 1652 [Google Scholar]
- Husser, T. O., Wende-von Berg, S., Dreizler, S., et al. 2013, A&A, 553, A6 [NASA ADS] [CrossRef] [EDP Sciences] [Google Scholar]
- Kamiński, T., Schmidt, M., Tylenda, R., Konacki, M., & Gromadzki, M. 2009, ApJS, 182, 33 [Google Scholar]
- Kamiński, T., Schmidt, M., & Tylenda, R. 2010, A&A, 522, A75 [NASA ADS] [CrossRef] [EDP Sciences] [Google Scholar]
- Kamiński, T., Menten, K. M., Tylenda, R., et al. 2020, A&A, 644, A59 [NASA ADS] [CrossRef] [EDP Sciences] [Google Scholar]
- Kamiński, T., Tylenda, R., Kiljan, A., et al. 2021, A&A, 655, A32 [NASA ADS] [CrossRef] [EDP Sciences] [Google Scholar]
- Lane, B. F., Retter, A., Thompson, R. R., & Eisner, J. A. 2005, ApJ, 622, L137 [NASA ADS] [CrossRef] [Google Scholar]
- Leinert, C., Graser, U., Przygodda, F., et al. 2003, Ap&SS, 286, 73 [NASA ADS] [CrossRef] [Google Scholar]
- Loebman, S. R., Wisniewski, J. P., Schmidt, S. J., et al. 2015, AJ, 149, 17 [NASA ADS] [CrossRef] [Google Scholar]
- Lopez, B., Lagarde, S., Jaffe, W., et al. 2014, The Messenger, 157, 5 [NASA ADS] [Google Scholar]
- Lynch, D. K., Rudy, R. J., Russell, R. W., et al. 2004, ApJ, 607, 460 [CrossRef] [Google Scholar]
- MacLeod, M., & Loeb, A. 2020, ApJ, 895, 29 [Google Scholar]
- MacLeod, M., Ostriker, E. C., & Stone, J. M. 2018, ApJ, 868, 136 [NASA ADS] [CrossRef] [Google Scholar]
- Meimon, S., Mugnier, L. M., & Le Besnerais G. 2008, J. Opt. Soc. Am. A, 26, 108 [Google Scholar]
- Munari, U., Desidera, S., & Henden, A. 2002a, IAU Circ., 8005, 2 [NASA ADS] [Google Scholar]
- Munari, U., Henden, A., Kiyota, S., et al. 2002b, A&A, 389, L51 [NASA ADS] [CrossRef] [EDP Sciences] [Google Scholar]
- Pastorello, A., Mason, E., Taubenberger, S., et al. 2019, A&A, 630, A75 [NASA ADS] [CrossRef] [EDP Sciences] [Google Scholar]
- Pejcha, O., Metzger, B. D., & Tomida, K. 2016, MNRAS, 455, 4351 [Google Scholar]
- Pejcha, O., Metzger, B. D., Tyles, J. G., & Tomida, K. 2017, ApJ, 850, 59 [NASA ADS] [CrossRef] [Google Scholar]
- Petrov, R. G., Malbet, F., Weigelt, G., et al. 2007, A&A, 464, 1 [NASA ADS] [CrossRef] [EDP Sciences] [Google Scholar]
- Polyansky, O. L., Kyuberis, A. A., Zobov, N. F., et al. 2018, MNRAS, 480, 2597 [NASA ADS] [CrossRef] [Google Scholar]
- Sparks, W. B., Bond, H. E., Cracraft, M., et al. 2008, AJ, 135, 605 [NASA ADS] [CrossRef] [Google Scholar]
- Tallon-Bosc, I., Tallon, M., Thiébaut, E., et al. 2008, in SPIE Conf. Ser., 7013 [Google Scholar]
- Tennyson, J., Yurchenko, S. N., Al-Refaie, A. F., et al. 2020, J. Quant. Spectr. Rad. Transf., 255, 107228 [NASA ADS] [CrossRef] [Google Scholar]
- Tylenda, R. 2005, A&A, 436, 1009 [NASA ADS] [CrossRef] [EDP Sciences] [Google Scholar]
- Tylenda, R., & Kamiński, T. 2016, A&A, 592, A134 [NASA ADS] [CrossRef] [EDP Sciences] [Google Scholar]
- Tylenda, R., & Soker, N. 2006, A&A, 451, 223 [NASA ADS] [CrossRef] [EDP Sciences] [Google Scholar]
- Tylenda, R., Kamiński, T., & Schmidt, M. 2009, A&A, 503, 899 [NASA ADS] [CrossRef] [EDP Sciences] [Google Scholar]
- Tylenda, R., Hajduk, M., Kamiński, T., et al. 2011, A&A, 528, A114 [NASA ADS] [CrossRef] [EDP Sciences] [Google Scholar]
- Western, C. M. 2017, J. Quant. Spectr. Rad. Transf., 186, 221 [NASA ADS] [CrossRef] [Google Scholar]
- Wisniewski, J. P., Bjorkman, K. S., & Magalhães, A. M. 2003a, ApJ, 598, L43 [NASA ADS] [CrossRef] [Google Scholar]
- Wisniewski, J. P., Morrison, N. D., Bjorkman, K. S., et al. 2003b, ApJ, 588, 486 [NASA ADS] [CrossRef] [Google Scholar]
- Wisniewski, J. P., Clampin, M., Bjorkman, K. S., & Barry, R. K. 2008, ApJ, 683, L171 [NASA ADS] [CrossRef] [Google Scholar]
- Woodward, C. E., Evans, A., Banerjee, D. P. K., et al. 2021, AJ, 162, 183 [NASA ADS] [CrossRef] [Google Scholar]
MDFC is available through the VizieR service at https://vizier.u-strasbg.fr/viz-bin/VizieR
All Tables
All Figures
|
Fig. 1 UV plane tracks for 19 January and 1 March in the L band. |
| In the text | |
|
Fig. 2 L-band spectra of V838 Mon. The solid gray lines represent individual calibrated spectra for both nights. The red line is a weighted-mean average spectrum, with error bars representing one standard deviation in individual spectra. The bottom panel shows opacity curves for four species. They are arbitrarily scaled. All simulations were smoothed to match the resolution of the observations. SiO and H2O curves weresimulated for circumstellar gas temperatures, while SH and OH were assumed to form in photospheric temperatures. The latter two are unlikely to be present in the spectrum of V838 Mon. |
| In the text | |
|
Fig. 3 Squared visibilities and closure phases as functions of spatial frequency for A1 models (cf. Table 3). Triangles represent the models, and the blue points represent the L-band MATISSE observables. |
| In the text | |
|
Fig. 4 Graphical representation of a sample of simple geometrical models. Left: A2i model for the elliptical disk and a single point source. Right: A3i model with an elliptical disk and two point sources (red circles). The transparency of the points corresponds to their relative fluxes. |
| In the text | |
|
Fig. 5 Reconstructed image of V838 Mon in the L-band range 2.95–4 μm. The low-intensity features are imaging artifacts. The colors represent brightness in arbitrary units. |
| In the text | |
|
Fig. 6 Image of the V838 Mon model at 3.5 μm based on the SED and ALMA observations. The component seen to the northwest is related to the B-type companion. For presentation purposes, the image was smoothed to a resolution of 2 mas. Colors represent brightness in units of Jy per beam. |
| In the text | |
|
Fig. 7 Sketch of the multiwavelength structure of V838 Mon based on observations that span from the MIR to the mm regime. |
| In the text | |
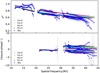 |
Fig. A.1 Same as Fig. 3 but for A2i models. |
| In the text | |
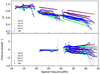 |
Fig. A.2 Same as Fig. 3 but for A2ii models. |
| In the text | |
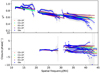 |
Fig. A.3 Same as Fig. 3 but for A3i models. |
| In the text | |
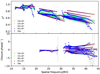 |
Fig. A.4 Same as Fig. 3 but for A3ii models. |
| In the text | |
Current usage metrics show cumulative count of Article Views (full-text article views including HTML views, PDF and ePub downloads, according to the available data) and Abstracts Views on Vision4Press platform.
Data correspond to usage on the plateform after 2015. The current usage metrics is available 48-96 hours after online publication and is updated daily on week days.
Initial download of the metrics may take a while.