Free Access
Fig. 3
Download original image
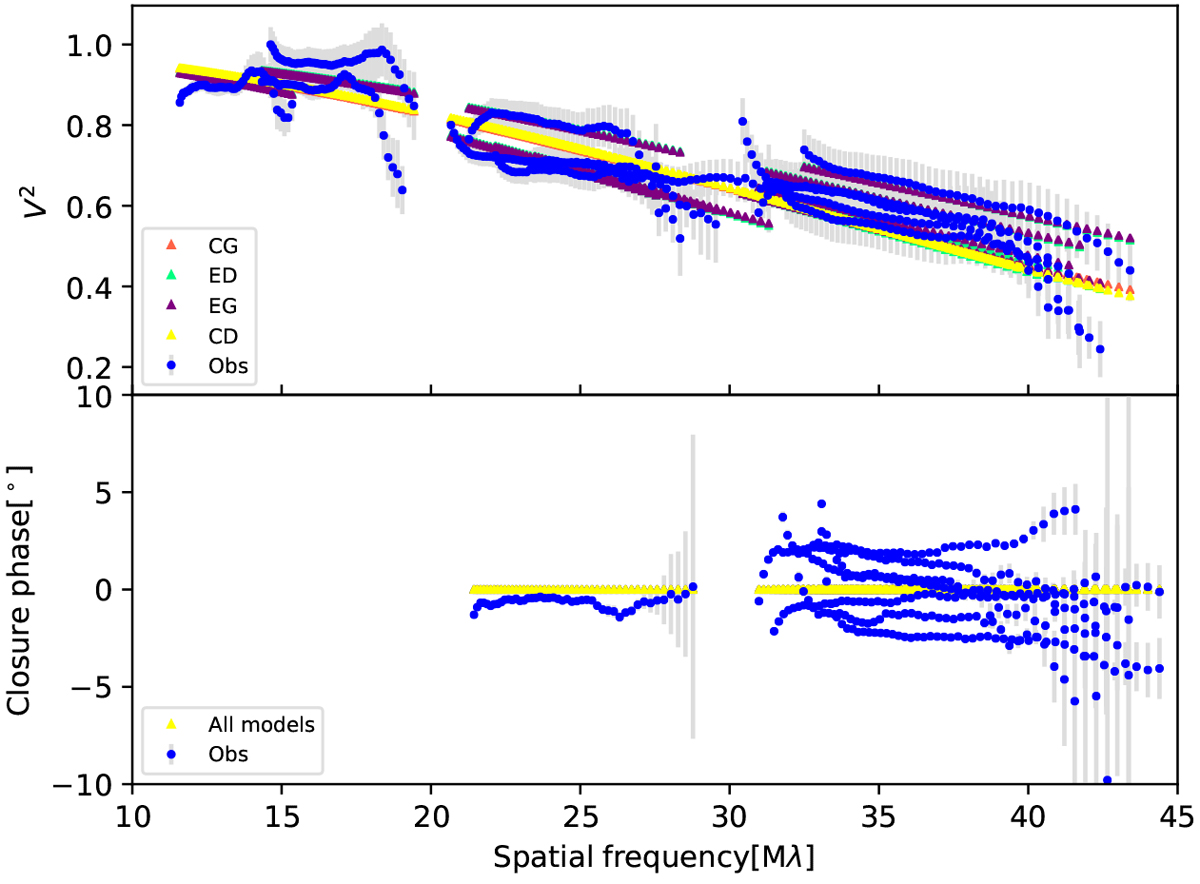
Squared visibilities and closure phases as functions of spatial frequency for A1 models (cf. Table 3). Triangles represent the models, and the blue points represent the L-band MATISSE observables.
Current usage metrics show cumulative count of Article Views (full-text article views including HTML views, PDF and ePub downloads, according to the available data) and Abstracts Views on Vision4Press platform.
Data correspond to usage on the plateform after 2015. The current usage metrics is available 48-96 hours after online publication and is updated daily on week days.
Initial download of the metrics may take a while.