Fig. 2
Download original image
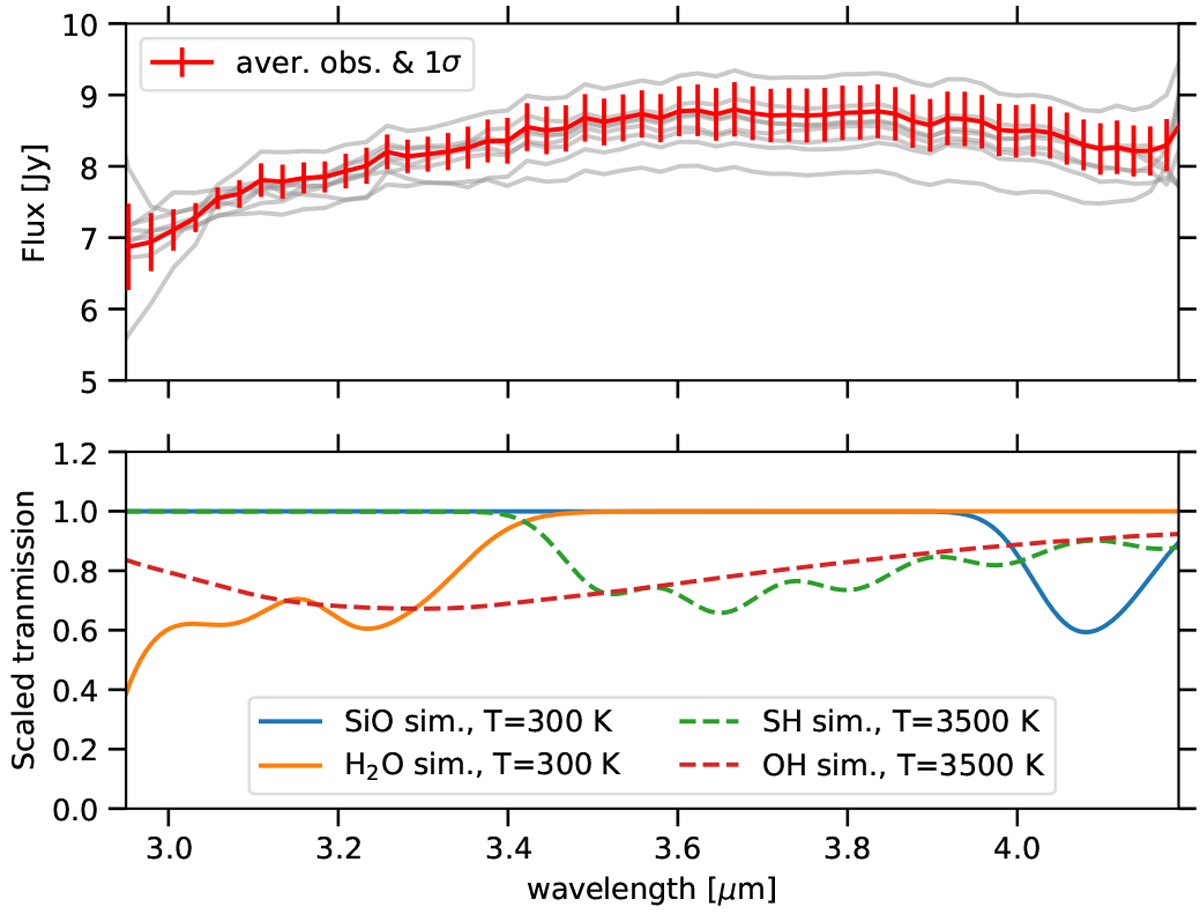
L-band spectra of V838 Mon. The solid gray lines represent individual calibrated spectra for both nights. The red line is a weighted-mean average spectrum, with error bars representing one standard deviation in individual spectra. The bottom panel shows opacity curves for four species. They are arbitrarily scaled. All simulations were smoothed to match the resolution of the observations. SiO and H2O curves weresimulated for circumstellar gas temperatures, while SH and OH were assumed to form in photospheric temperatures. The latter two are unlikely to be present in the spectrum of V838 Mon.
Current usage metrics show cumulative count of Article Views (full-text article views including HTML views, PDF and ePub downloads, according to the available data) and Abstracts Views on Vision4Press platform.
Data correspond to usage on the plateform after 2015. The current usage metrics is available 48-96 hours after online publication and is updated daily on week days.
Initial download of the metrics may take a while.