| Issue |
A&A
Volume 655, November 2021
|
|
|---|---|---|
| Article Number | A97 | |
| Number of page(s) | 12 | |
| Section | Extragalactic astronomy | |
| DOI | https://doi.org/10.1051/0004-6361/202141604 | |
| Published online | 01 December 2021 | |
Lopsided galactic bars
Nicolaus Copernicus Astronomical Center, Polish Academy of Sciences, Bartycka 18, 00-716 Warsaw, Poland
e-mail: This email address is being protected from spambots. You need JavaScript enabled to view it.
Received:
21
June
2021
Accepted:
6
September
2021
Abstract
Most of the observed and simulated galactic bars are symmetric in the face-on view. However, there are indeed cases of bars that are off-center with respect to the disk or have an asymmetric shape. The only well-known example showing both these features is the Large Magellanic Cloud. We report on the identification of several lopsided galactic bars in the Illustris TNG100 simulation found among a sample of elongated bar-like galaxies studied in the past. The bars show a clear asymmetry in the face-on view, which is in the shape of a footprint. We measured the evolution of the different parameters of the bars’ shape and asymmetry as a function of time and find that the asymmetry is preserved for a few Gyr. It can grow together with a bar or appear later, after bar formation. We considered two scenarios leading to the formation of lopsided bars using controlled simulations. In the first, a Milky Way-like galaxy interacts with a massive companion placed on a radial orbit in the plane of the disk and perpendicular to the orientation of the bar at the time of the first passage. In the second, the galaxy initially has an off-center disk and the growth of the bar and its asymmetry is more similar to the one found in IllustrisTNG galaxies, where it is also preceded by the presence of an asymmetric disk. It is thus possible that lopsided bars are born in lopsided disks, although in some cases, the time difference between the occurrence of the asymmetry in the two components is quite large.
Key words: galaxies: evolution / galaxies: interactions / galaxies: kinematics and dynamics / galaxies: structure / galaxies: general
© ESO 2021
1. Introduction
A significant fraction of galaxies in the Universe appear to be barred (Buta et al. 2015). This fraction depends on the sample selection, stellar mass, gas content, environment, and redshift and it may reach as high as 60% (Sheth et al. 2008; Skibba et al. 2012; Melvin et al. 2014; Díaz-García et al. 2016). The bars are typically symmetric, elongated structures embedded in well-formed disks. Similar structures are reproduced in simulations of galaxy formation, independently of their origin, whether they are formed via bar instability in isolation (Hohl 1971; Ostriker & Peebles 1973; Sellwood 1981; Athanassoula & Misiriotis 2002; Debattista et al. 2006; Athanassoula et al. 2013) or as a result of tidal interactions with other objects (Gerin et al. 1990; Noguchi 1987; Miwa & Noguchi 1998; Łokas et al. 2014; Łokas 2018).
The symmetry seems to be an inherent feature of the bars, with the notable exception of the bar in the Large Magellanic Cloud (LMC). While this bar has typically been considered lopsided because of its off-center position with respect to the disk, it seems to be asymmetric also in its intrinsic shape, as demonstrated in the studies of van der Marel (2001) and Jacyszyn-Dobrzeniecka et al. (2016). A whole class of Magellanic-type galaxies was later identified (Odewahn 1994), but this name again has referred to their bars being offset with respect to the disks, rather than being asymmetric in shape. Recent simulations of the LMC formation have also been aimed at reproducing the off-center bar, rather than the asymmetric one (Bekki 2009; Besla et al. 2012; Pardy et al. 2016). The phenomenon is not rare; Kruk et al. (2017) identified as many as 270 late-type galaxies with off-center bars using Sloan Digital Sky Survey (SDSS) images and Galaxy Zoo morphologies.
The studies of asymmetric structures in galaxies have thus far been focused on lopsided disks rather than bars since there is much more observational material on hand in the former case (Jog & Combes 2009). For example, Rix & Zaritsky (1995) found that out of 18 face-on spirals they studied, about 1/3 were substantially lopsided with significant values of odd Fourier modes. These results were later confirmed and extended to 147 galaxies of the OSUBGS sample by Bournaud et al. (2005). More recently, Zaritsky et al. (2013) confirmed the high incidence of lopsidedness in their sample of 167 galaxies, spanning a wide range of luminosities and morphologies. Bournaud et al. (2005), Mapelli et al. (2008) and Ghosh et al. (2021) considered the possible origin of lopsidedness in galactic disks using simulations of galaxy evolution. The conclusion from these studies was that although interactions such as flybys or minor mergers are a plausible cause for such distortions, they cannot explain all occurrences of this phenomenon given its presence in isolated galaxies as well.
In recent years, studies of the origin of galaxy morphology have entered a new era with the advent of cosmological simulations that produce large samples of galaxies with a resolution that makes it possible to discern their basic morphological features. One such set of simulations of galaxy formation is that of the IllustrisTNG collaboration (Springel et al. 2018; Marinacci et al. 2018; Naiman et al. 2018; Nelson et al. 2018; Pillepich et al. 2018). Various studies performed thus far have demonstrated that these simulations are able to reproduce many of the observed properties of galaxies, including their morphologies (Nelson et al. 2018; Genel et al. 2018; Rodriguez-Gomez et al. 2019). IllustrisTNG (and the earlier Illustris) simulations have been used, in particular, to study the formation and properties of galactic bars (Peschken & Łokas 2019; Rosas-Guevara et al. 2020; Zhou et al. 2020; Zhao et al. 2020). Recently, we extended these efforts (Łokas 2021) to include an additional class of bar-like galaxies selected on the basis of a single criterion: namely, that the stellar component is sufficiently elongated. The 277 galaxies chosen in this way differ from the typical barred galaxies studied earlier in the sense that these are not bars embedded in disks but, instead, almost their whole stellar component is elongated and prolate.
The detailed properties of these objects and their evolutionary histories are presented in Łokas (2021) with three fiducial examples. During the course of this study, we also inspected the face-on mock images of these objects and discovered among them ten cases of asymmetric or lopsided bars, which comprise the subject of the present paper. We further restricted the sample considered here to six objects by rejecting three for which the degree of asymmetry was rather low and one that is strongly distorted due to an ongoing merger. Although some of the bars considered in the earlier studies based on IllustrisTNG (Rosas-Guevara et al. 2020; Zhao et al. 2020) also show some degree of asymmetry, these bars are generally weaker and their asymmetry is also less pronounced. Therefore, we restricted the present study to bar-like objects that are significantly stronger bars overall. In the next section, we describe the properties of the lopsided bars identified among the bar-like galaxies from IllustrisTNG. In Sect. 3, we present controlled simulations of possible scenarios for the formation of lopsided bars. Our discussion is presented in the last section.
2. Lopsided bars in IllustrisTNG
In this study, we used the publicly available simulation data from the 100 Mpc box of the IllustrisTNG project, as described by Nelson et al. (2019). This simulation has at redshift z = 0 the Plummer-equivalent gravitational softening length for the collisionless components (dark matter and stars), ϵ = 0.74 kpc, and the median stellar particle mass, 1.6 × 10⁶ M⊙ (Pillepich et al. 2018). The TNG100 run provides a sufficiently numerous sample of galaxies with a good enough resolution for analyzing different morphological samples. We used the subsample of bar-like galaxies from Łokas (2021) selected at z = 0 that had total stellar masses greater than 1010 M⊙ (104 stellar particles per object) and that obeyed the morphological condition of the intermediate to longest axis ratio b/a of the stellar component lower than 0.6. The axis ratios were estimated from the eigenvalues of the mass tensor of the stellar mass within two stellar half-mass radii, 2r1/2, as described in Genel et al. (2015).
Among the sample of 277 bar-like galaxies, we found (via visual inspection) six objects that showed a significant asymmetry of the bar in the face-on image and were otherwise regular. The surface density distributions of the stars for these six galaxies at the present time (z = 0, the last simulation output) are shown in Fig. 1. In each case, the images are rotated so that the longest axis of the stellar component and the bar are along the x axis of the plot and centered on the dynamical center of the galaxy, which for Illustris galaxies is determined as the position of the particle with the minimum gravitational potential energy. The asymmetry is clearly visible in these images in the form of a footprint-like shape (or banana-like, as in one case).
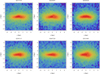 |
Fig. 1. Surface density distribution of the stellar components of the lopsided bars from IllustrisTNG, in the face-on view at the present time. The surface density, Σ, is normalized to the central maximum value in each case and the contours are equally spaced in logΣ. |
Except for the asymmetry of their bars, the galaxies are typical examples of the bar-like galaxies discussed in Łokas (2021) in terms of their masses, shapes, and evolutionary histories. Table 1 lists the most important properties of the galaxies. The first column of the Table gives the identification number of the galaxy according to the subhalo catalogs of the Illustris TNG100 simulation. The next three columns list the stellar, gas, and dark matter total masses. The dark and stellar masses of the galaxies are similar to those of the Milky Way (MW) or slightly smaller. The majority of the galaxies also contain a significant amount of gas, but mostly in the outskirts.
Properties of lopsided bars from IllustrisTNG at z = 0.
The evolutionary histories of the six galaxies with lopsided bars are quite different, as was the case for the general population of bar-like objects discussed previously by Łokas (2021). The first two galaxies in the Table are members of clusters and, therefore, they already lost all their gas and most of their dark matter due to ram pressure and tidal stripping. The second pair of galaxies shown in the table also interacted with more massive structures, but much more weakly, thus retaining some of the gas and most of the dark matter. The last pair evolved mostly in isolation from more massive objects growing in mass until now.
In order to describe the shape of the bars quantitatively, it is useful to calculate different modes of the Fourier decomposition of the surface density distribution of stellar particles projected along the short axis, Am(R)=|Σjmj exp(imθj)|/Σjmj, where θj is the azimuthal angle of the jth star, mj is its mass, and the sum goes up to the number of particles in a given radial bin. In the left panel of Fig. 2, we plot the dependence of the bar mode, A2, on the cylindrical radius at the present time. All the profiles show a behavior characteristic of bars, in spite of their asymmetry, that is, the values of A2 first increase with radius, reaching a maximum and then decreasing. Because of the asymmetry, one side of the bar contributes more to the A2 value, but the A2 mode is still the dominant one and departures from the symmetry are to be quantified with the odd modes, as discussed below. The bars are quite strong, with the maximum A2 values above 0.5 in all cases.
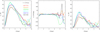 |
Fig. 2. Profiles of bar mode A2(R) (left panel), the phase of the bar mode ϕ2(R) (middle panel), and the m = 4 mode A4(R) (right panel) for IllustrisTNG galaxies with lopsided bars at the present time. Measurements were carried out in bins of ΔR = 0.5 kpc. |
The radii where the A2 profile drops to half the maximum can be used to estimate the length of the bar and we see that these lengths are on the order of 6 kpc for all bars at the present time, in agreement with the visual impression from Fig. 1. The middle panel of Fig. 2 shows the profiles of the phase angle of the m = 2 Fourier mode, ϕ2(R). We see that its values are constant and close to zero out to radii of the order of 6–7 kpc. Since such radii can also be used as estimates of the bar length we find them to agree with the lengths estimated from the behavior of the A2 profile. Finally, the right panel of Fig. 2 shows the profiles of the m = 4 Fourier modes A4 known to be typically excited in bars, in addition to m = 2 modes. Their values are significant, although smaller than A2, with maximum values above 0.2 for all galaxies.
Figure 3 illustrates the evolution of the different measures of the shape of the galaxies. As mentioned before, the axis ratios and all the other properties discussed below were estimated using stars contained within two stellar half-mass radii, 2r1/2, listed in the fifth column of Table 1 for the present time. The six panels of the figure plot the evolution of the intermediate to longest b/a and shortest to longest c/a axis ratio as a function of time as well as the triaxiality parameter, T = [1 − (b/a)2]/[1 − (c/a)2], for the six lopsided bars. The final values of b/a, c/a, and T for all galaxies are given in columns 6–8 of Table 1. In all cases, the ratio b/a is initially close to unity and T is close to zero, so the galaxies are oblate disks. At some point, however, the b/a start to decrease and T to increase signifying a transition from an oblate to a prolate shape, which indicates the formation of a bar.
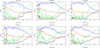 |
Fig. 3. Evolution of the shape of the lopsided bars from IllustrisTNG. Blue and red lines plot the intermediate to longest b/a and the shortest to longest c/a axis ratios, respectively. Green and black lines show the evolution of the triaxiality parameter, T, and the bar mode, A2. Vertical gray lines indicate the times of bar formation. |
The strength of the bar in the form of the m = 2 mode for stars within two stellar half-mass radii, 2r1/2, is also plotted in Fig. 3 and we can see that its evolution traces that of the triaxiality. The final values of A2 are listed in column 9 of Table 1. In vertical gray lines, we marked the times where A2 crosses the value of 0.2 for the first time, which can be adopted as the time of bar formation. This choice, while it may appear rather arbitrary, reflects the presence of an elongated shape and is useful as an operational definition for the onset of the bar.
The asymmetry of the distribution of stars in the bars can be described by the odd modes of the Fourier decomposition. Figure 4 shows the evolution of Am for m = 1, 3, 5, and 7 for the six galaxies in the same time range as in Fig. 3. Columns 10–12 of Table 1 list the final values of A1, A3 and A5. We can see that the m = 1 mode, signifying asymmetry in the disks, varies strongly with numerous peaks at early stages of the evolution when the galaxies are forming and experience mergers and accretion events, but is usually subdominant at later stages when the bar is already in place. Then A3 and A5 take largest values and A7 is again smaller. Thus, A3 and A5 can be considered as the best signatures of the lopsidedness of the bars and we note that they preserve the values of the order of 0.1 for a few Gyr. This means that the lopsidedness is not a transient feature but, rather, a stable property of the bars. We also note that the asymmetry can occur at different stages of bar formation. In some cases, the asymmetry develops after the bar is formed (ID447236) and sometimes around the time of bar formation (ID250397), which means that the bar is born asymmetric.
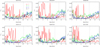 |
Fig. 4. Odd Fourier modes of the stellar component of IllustrisTNG galaxies measured within two stellar half-mass radii, 2r1/2, as function of time. The red, green, blue, and black lines show the results for m = 1, 3, 5, and 7, respectively. Vertical gray lines indicate the times of bar formation. |
We have found that the hierarchy of the odd Am modes is different from the one found in lopsided disks where the m = 1 mode dominates (Rix & Zaritsky 1995; Bournaud et al. 2005). The reason for this is that in the later stages of the evolution of the galaxies studied here the disk is not lopsided and the dominant structural property is the presence of the bar, as confirmed by the highest values of the m = 2 and m = 4 modes. The m = 3 and m = 5 modes can be understood as corrections to the even bar modes describing the departures of the bar from symmetry. Geometrically, non-zero m = 3 and m = 5 modes can be associated with the triangular and pentagonal shape of the bar, respectively.
In order to fully explore the information contained in the Fourier modes, in Figs. 5 and 6, we show their dependence on both time and radius for two galaxies with the largest asymmetry that is also preserved for a long time, namely, ID250397 and ID511905. The figures plot the evolution of the profiles of the Fourier modes, Am, in time for m = 1 to m = 5 (from top to bottom) in a color-coded format. The bin size in radius is ΔR = 0.5 kpc (as before) and the average time difference between IllustrisTNG snapshots is Δt = 0.16 Gyr. The second and fourth panels of these figures illustrate the formation of the bar in terms of A2(R, t) and A4(R, t). They can also be used to estimate the bar length at different times by finding a radius where the A2 value drops to half its maximum.
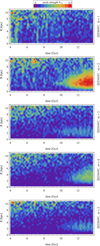 |
Fig. 5. Evolution of the profiles Am(R) over time for galaxy ID250397 from IllustrisTNG. The five panels from top to bottom show the results for m = 1–5. |
 |
Fig. 6. Evolution of the profiles Am(R) over time for galaxy ID511905 from IllustrisTNG. The five panels from top to bottom show the results for m = 1–5. |
For ID250397, the bar starts to form rather late, around t = 10 Gyr, and the non-zero signal in A3 and A5 (third and fifth panel) also starts to be visible around this time, while A1 (first panel) is then consistent with the noise. On the other hand, for ID511905, the bar is already forming at t = 7 Gyr, while any asymmetry, in the form of non-zero A3 and A5, starts to be visible later, around t = 10 Gyr. Again, very little asymmetry in terms of A1 is seen in the later stages.
In addition to this detailed study of the shape of the bars in terms of axis ratios and Fourier modes, we also looked at their kinematics in order to determine if it is in any respect different in comparison with normal, symmetric bars. It turns out that the velocity distribution in the lopsided bars in terms of mean velocity and dispersion is very similar to that of symmetric bars; namely, there is a strong rotation signal in the edge-on and end-on view and no significant rotation in the face-on projection (Athanassoula & Misiriotis 2002; Łokas 2020). The maps of velocity dispersion are also very much the same, with one strong maximum in the end-on view and two maxima in the edge-on and face-on projection.
It is interesting to consider what might have caused the asymmetry of the bars. An obvious candidate is certainly some kind of interaction with neighboring structures. In order to verify this hypothesis, we studied the interactions of the selected sample of lopsided bars with other objects. In each case, we found mergers and flybys of smaller and bigger structures, however, as a result of the nature of cosmological simulations, there are typically a few interactions ongoing at the same time. Moreover, it takes time for the galaxy to respond dynamically to a given interaction. As discussed above, the selected galaxies have very different evolutionary histories. Some are cluster members that have therefore experienced encounters with other massive galaxies, albeit at high velocities. Others evolved in relative isolation, experiencing only minor mergers. All these factors make it extremely difficult to identify a clear pattern that would point toward a specific configuration.
Another scenario for the formation of lopsided bars is suggested by the evolution of the odd modes shown in Fig. 4. As we have seen, in some simulation outputs, usually up to about t = 7 Gyr, all galaxies show strong peaks in the m = 1 mode. We verified that in simulation outputs corresponding to the last peak occurring in each galaxy, their stellar disks are indeed lopsided or off-center. The asymmetry is most probably caused by off-center star formation in the asymmetrically distributed gas that is abundantly present in these galaxies at these times. It is possible that these departures from symmetry affected the subsequent evolution of these galaxies, in particular, the formation of the bar. In the next section, we consider these two scenarios using controlled simulations.
A further possibility is that lopsidedness develops in bars spontaneously in favorable conditions. Previous theoretical works have demonstrated that asymmetric orbits of stars in bars can occur in strong-enough bars or with specific mass distributions. In particular, Martinet (1984) and Pfenniger (1984), in their studies of the orbital structure of bars, identified asymmetric orbits as bifurcations of the standard x1 family that are believed to provide the main building blocks of bars. It remains to be discovered under what conditions such orbits can dominate the structure of the bar. The occurrence of these conditions must, however, be rare because most of the bars seen in the Universe and in the simulations are indeed symmetric.
3. Controlled simulations of the formation of lopsided bars
3.1. MW-like galaxy interacting with a satellite
Trying to identify the mechanism responsible for the formation of a lopsided bar, we performed multiple controlled simulations of a MW-like galaxy interacting with a satellite of different mass and orbit. In most cases, the effect of such interactions on the forming or pre-existing bar is symmetric because of the approximately symmetric nature of the tidal force acting on the host. Any distortions that occur in such interactions are very short-lived and therefore do not explain the long-term asymmetries seen in the lopsided bars identified in IllustrisTNG.
The simulation that finally ended up producing an asymmetry, which we report below, was inspired to some extent by the recent results of Collier et al. (2019) and Collier & Madigan (2021) who considered the effect of a counter-rotating halo on the bar formation in the disk. They found that such a halo is much less efficient in transferring the angular momentum from the disk than a corotating or isotropic one and, thus, the bar is forming more slowly. We applied this mechanism when constructing a controlled simulation of interacting galaxies and the formation of a lopsided bar, as follows.
For the purpose of the simulation, we used the N-body model of the MW from Łokas (2019), which was used to study buckling instability in that work. The galaxy is made of two components: a spherical dark matter halo and an exponential disk. The dark matter halo has an Navarro-Frenk-White (Navarro et al. 1997) profile with a virial mass of MH = 1012 M⊙ and concentration of c = 25, while the exponential disk had a mass of MD = 4.5 × 10¹⁰ M⊙, scale-length of RD = 3 kpc, and thickness of zD = 0.42 kpc, with the central value of the radial velocity dispersion of σR, 0 = 120 km s−1. The minimum value of the Toomre parameter for this model at 2.5RD is Q = 1.73, so the model was shown to be mildly unstable and forming a bar slowly over the first few Gyr when evolving in isolation.
The companion was assumed to contain only dark matter and exhibited a steep Navarro-Frenk-White profile with a an exponential cut-off at 10 kpc and the total mass of MC = 4.5 × 10¹⁰ M⊙, thus equal to the disk mass of the host galaxy. In the inner parts, the density of the companion was comparable to the dark matter density of the host. The N-body realizations of both galaxies were created with the procedures described in Widrow & Dubinski (2005) and Widrow et al. (2008) with each component of the host and the companion containing 106 particles, respectively. The evolution of the interacting galaxies was followed with the GIZMO code (Hopkins 2015), an extension of the widely used GADGET-2 (Springel et al. 2001; Springel 2005). The adopted softening scales were ϵD = 0.03 kpc for the disk and the satellite, and ϵH = 0.06 kpc for the halo of the galaxy, respectively.
For the initial conditions of this simulation we selected an output of the evolution of the MW-like galaxy in isolation corresponding to t = 2.25 Gyr from the start, when the bar is already forming. The disk of the galaxy was in the XY plane of the simulation box, centered at (X, Y, Z)=(0, 0, 0) kpc and was rotating so that its angular momentum was along the positive Z axis. This initial configuration is shown in the face-on projection in the upper left panel of Fig. 7. The companion was placed at (X, Y, Z)=(0, −100, 0) kpc and assigned the velocity (VX, VY, VZ)=(0, 100, 0) km s−1. It was therefore on the radial orbit toward the galaxy, in the plane of the disk, that is moving upward along the X = 0 axis in the upper left panel of Fig. 7. The evolution was followed for 2 Gyr, with outputs saved every 0.05 Gyr. With such initial conditions, the collision, in terms of the first passage of the satellite through the center of the MW disk, takes place after 0.5 Gyr. The upper middle panel of Fig. 7 shows the distorted bar just after the first encounter with the satellite. We also note that the center of the bar is shifted toward negative Y as a result of the attraction from the satellite. Since the companion is bound to the galaxy, it soon turns around and oscillates around its center, producing a system of approximately concentric shells that are expected to form in such collisions (Ebrová et al. 2012).
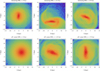 |
Fig. 7. Surface density distributions in the face-on view of the stellar components of the MW-like galaxies in the controlled simulations. The coordinate system is that of the simulation box, with the galaxy disk always in the XY plane. In all images, the galaxy is rotating counter-clockwise. The three upper panels show three stages of the evolution for the MW interacting with a satellite and the three lower panels three stages of the simulation of the MW with an off-center disk. The initial configurations are presented in the left-column plots. The surface density, Σ, is normalized to the central maximum value in each case and the contours are equally spaced in logΣ. |
The initial conditions were chosen so that at the time of the collision the bar forming in the MW is perpendicular to the trajectory of the perturber. In such a configuration, at the time of the first passage, the satellite acts differently on each side of the bar. On one side, the additional material contributed by the satellite is moving in the same direction as the bar, thus acting as a co-rotating (prograde) halo and speeding up the formation of the bar. On the other side, it is moving in the opposite direction to the bar, thus acting as a counter-rotating (retrograde) halo and weakening the bar. The effect of the passage of the companion is thus different on each side, resulting in the formation of a lopsided bar. An example of such a bar with significant asymmetry, at t = 0.9 Gyr from the start of the simulation, is shown in the upper right panel of Fig. 7.
The upper left panel of Fig. 8 shows the evolution of different measures of shape of the interacting galaxy in a way that is similar to Fig. 3 for the IllustrisTNG galaxies. The axis ratios b/a, c/a, the triaxiality T, and the bar mode A2 were calculated using MW stars within 2RD = 6 kpc with the center of the stellar mass determined iteratively in spheres of decreasing size down to the radius of 0.5 kpc. The vertical gray line marks the formation of the bar, namely, the time when A2 becomes larger than 0.2. This is also the time when the bar starts to grow rapidly as a result of the interaction with the satellite. It then regains equilibrium with A2 remaining at the level of about 0.3, and later around t = 1.5 Gyr, it experiences a weak buckling episode.
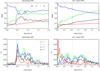 |
Fig. 8. Results of controlled simulations of the formation of lopsided bars in MW-like galaxies. Upper panels: evolution of the shape of the interacting MW (left) and the MW with an off-center disk (right). The blue and red lines plot the intermediate to longest b/a and the shortest to longest c/a axis ratios, respectively. The green and black lines show the evolution of the triaxiality parameter T and the bar mode A2. Lower panels: odd Fourier modes of the stellar component of the interacting MW (left) and the MW with an off-center disk (right) as a function of time. The red, green, blue, and black lines show the results for m = 1, 3, 5, and 7, respectively. In all panels, the vertical gray line indicates the time of bar formation. |
The lower left panel of Fig. 8 shows the evolution of the odd Fourier modes Am, with m = 1, 3, 5, and 7 in a way that is similar to Fig. 4 for IllustrisTNG galaxies. We see that the modes start to grow rapidly at the time of interaction and preserve their enhanced values for about 1 Gyr. Later they decrease and reach the pre-interaction level at about t = 1.5 Gyr, that is at the time of buckling. The hierarchy of the modes is similar to that of the IllustrisTNG galaxies at the later stages, namely, the A1 mode is subdominant, while A3 and A5 have the highest values.
A fuller picture of the bar properties can be obtained by viewing the color-coded images of the dependence of Am modes on both radius and time. These are shown in Fig. 9, in a set of plots similar to those of Figs. 5 and 6 for two IllustrisTNG galaxies. Here, the bin size in radius is again ΔR = 0.5 kpc and the subsequent snapshots differ by Δt = 0.05 Gyr. As before, the color map of the evolution of A2 can be used to estimate the bar length at different times by finding the radius where the A2 value drops to half its maximum. As expected, the length of the bar is very much increased during the interaction as the bar is stretched, but then it settles to a value of about 6 kpc. The asymmetry as measured by A1 dominates in the outskirts of the disk, outside the bar, while A3 and A5 have the highest values between R = 2 and R = 8 kpc.
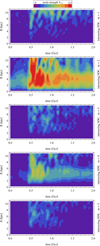 |
Fig. 9. Evolution of the profiles Am(R) over time for the controlled simulation of the interacting MW. The five panels from top to bottom show the results for m = 1–5. |
We compared the evolution of the odd modes in the interacting case to the case when the MW evolves in isolation by measuring Am in the same way. We found that in this case, A3 and A5 increase slightly for a short period of time, reaching values of about 0.02. This happens just before buckling, after which the odd modes decrease to the noise level again. This short occurrence of the weak asymmetry may be related to the appearance of orbits with a loop on one end, as shown for the one example orbit plotted in the upper left panel of Fig. 9 in Łokas (2019). After buckling, the orbital structure is completely rebuilt and asymmetric orbits seem to disappear. The same seems to occur in the interacting MW model discussed here since the asymmetry also disappears after buckling, although in this case, the buckling is much weaker. A few examples of orbits contributing to the lopsided shape of the bar are presented in the appendix.
3.2. MW-like galaxy with an off-center disk
Trying to assess the role of interactions in creating off-center bars, Kruk et al. (2017) searched for neighbors around the galaxies with off-center bars in their sample and concluded that, surprisingly, a significant fraction of them were isolated. These authors noted that this phenomenon may be caused by the misalignment between the disk and the halo, as discussed by Levine & Sparke (1998), who performed simulations of the evolution of a galaxy with a disk shifted with respect to the halo. As is visible in their Fig. 1, such a configuration produces not only an off-center, but also a lopsided bar. Since we found signatures of such off-center disks in our galaxies with lopsided bars from IllustrisTNG, here we take a closer look at how such a configuration may affect the properties of the forming bar.
In order to verify whether this is a viable scenario for the formation of a lopsided bar, we performed simulations of our MW model with the disk displaced with respect to the halo center. For the purpose of these simulations, we used the same MW model as described in the previous subsection, initially containing an exponential disk and a dark matter halo. The disk was shifted by one disk scale-length RD = 3 kpc in the direction of positive X axis of the simulation box, as shown in the lower left panel of Fig. 7. We tried smaller and larger shifts as well and found that shifts of RD/3 = 1 kpc and 2RD/3 = 2 kpc lead to very little asymmetry in the formed bars while a larger shift of 2RD = 6 kpc leads to the formation of an elongated structure but with a large bulge-like component in the center that does not especially resemble a bar. Therefore, in this work, we describe only the simulation with the shift of one disk scale-length, evolved for 5 Gyr. This configuration indeed led to the formation of a lopsided bar, as confirmed by the face-on images of the stellar component shown in the lower middle and lower right panels of Fig. 7.
In the upper right panel of Fig. 8 we plot the evolution of the measures of shape of this galaxy: the axis ratios, b/a, c/a, the triaxiality, T, and the bar mode, A2, calculated in the same way as for the interacting model, but up to 3 Gyr. The vertical gray line marks again the time of the formation of the bar, when A2 grows above 0.2. We see that except for the very beginning, the evolution is now less violent, with the b/a ratio decreasing and the remaining parameters slowly increasing.
The lower right panel of Fig. 8 shows the evolution of the odd Fourier modes Am, with m = 1, 3, 5, and 7. We see that in contrast to the interacting model, the m = 1 mode grows strongly at the beginning, signifying the temporary presence of a lopsided disk as it falls into the potential well of the dark halo. Once the galaxy settles into equilibrium and the bar starts to grow, this mode becomes subdominant with respect to the other odd modes. The values of A3 and A5 retain significant non-zero values after the bar formation for about 1 Gyr, which means that the bar is indeed lopsided. After about 2 Gyr of evolution, they start to decrease and the bar becomes more symmetric. Contrary to the case of the interacting galaxy, this behavior is not associated with buckling because in this case the buckling occurs as late as around 4 Gyr, but it does further decrease the odd modes.
In Fig. 10, we show the color-coded images of the dependence of Am modes on both radius and time. The bin sizes in radius and time are the same as for the interacting model, ΔR = 0.5 kpc and Δt = 0.05 Gyr. The evolution of A2 and A4 (the second and fourth panels) confirms the steady growth of the bar and the map for A2 can be used to estimate the bar length at different times by finding the radius where the A2 value drops to half its maximum. Contrary to the case of the interacting MW, the length of the bar increases steadily and at t = 1.75 Gyr, it is equal to about 8 kpc, which is in agreement with the visual impression from the lower right panel of Fig. 7. The first panel of Fig. 10 shows the map for A1 and confirms the high initial values of the m = 1 mode due to the presence of the lopsided disk. Later on, only the A3 and A5 odd modes show non-zero values in the bar region, between the radii R = 2 kpc and R = 6 kpc.
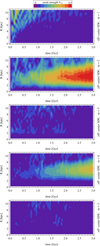 |
Fig. 10. Evolution of the profiles Am(R) over time for the controlled simulation of the MW with the off-center disk. The five panels from top to bottom show the results for m = 1–5. |
4. Discussion
In this work, we present a few convincing examples of lopsided bars formed in simulations of galaxy evolution in the cosmological context. The bars are lopsided in the sense that they possess a significant degree of asymmetry in their face-on images. These objects differ from the well-known class of Magellanic-type galaxies that, instead, have off-center bars that are embedded in asymmetric disks. We show here that the asymmetry of the bars is a long-lived feature, rather than a transient one, and can be sustained for a few Gyr. The asymmetry can grow along with the bar or it can occur later in its evolution.
An obvious candidate for the mechanism inducing the asymmetry of the bars is some sort of interaction with another galaxy. By tracing the interactions of the lopsided bars identified in IllustrisTNG, we identified a number of flybys and mergers for each of them, but failed to pinpoint a configuration that they all have in common that could lead to the asymmetry. Using a controlled simulation of a MW-like galaxy interacting with a massive companion, we propose a particular mechanism that leads to the formation of lopsidedness in the bar. In our simulation, the satellite is placed on a radial orbit in the plane of the disk so that its trajectory is perpendicular to the already forming bar. Although the satellite is as massive as the MW disk, the bar survives the interaction – and it is even enhanced. At the same time, because of the asymmetry in the effects of the satellite on both sides of the bar, it becomes lopsided. The asymmetry is retained until the bar buckles, which suggests that during buckling, the orbital structure is rebuilt so that it becomes again symmetric in the face-on view.
We also considered an alternative scenario for the formation of a lopsided bar inspired by the study of Levine & Sparke (1998), aimed at reproducing the off-center bars. In this model, the galaxy disk is initially displaced with respect to the dark matter halo. The bar forming in such a configuration also shows some degree of asymmetry. The feature persists for a significant amount of time but is weaker and disappears even before buckling. However, the exact amount of asymmetry may depend on many parameters that were not varied here.
Comparing the evolution of the Am modes in the two scenarios shown in Figs. 8–10 to the analogous results for the IllustrisTNG galaxies in Figs. 3–6, we see that the time dependence of the modes in IllustrisTNG bars is more similar to the scenario with the off-center disk. The even modes grow more gradually while the odd modes show an early peak in the m = 1 mode followed by an increase in the higher odd modes. The situation involving the scenario with the interacting MW is different: there is a sharp increase in the bar mode, but the m = 1 mode is never very strong.
We may therefore conclude that the scenario with the off-center disk is more probable for the formation of lopsided bars. This would mean that the bars inherit their lopsidedness from the disks. The caveat here is that at the time of the occurrence of the last m = 1 peak in IllustrisTNG galaxies, they are not yet forming bars (except for ID177725) and the m = 1 peaks are very short-lived, so it is hard to imagine a strong causal relation between the lopsided disks and lopsided bars. This problem is particularly evident in the case of ID511905, where the bar forms and its asymmetry starts to be visible almost 5 Gyr after the last peak in A1.
Although the LMC is considered to be a prototype of Magellanic-type galaxies with off-center bars, its deprojected face-on image (van der Marel 2001) suggests that its bar is not only off-center with respect to the disk, but also lopsided. A more recent study by Jacyszyn-Dobrzeniecka et al. (2016), based on cepheids from the OGLE project, has found that the LMC bar is probably not strongly off-center but still asymmetric. LMC is thus the first known, convincing example of a lopsided bar. It is possible that the two phenomena are, in fact, related, although the existing simulations aiming to reproduce the shape of LMC fail to form a lopsided bar, but they do succeed in having it off-center with respect to the disk. Another example of a galaxy with a lopsided bar is the dwarf irregular DDO 168, as discussed by Patra & Jog (2019). It remains to be seen how many of the Magellanic-type galaxies turn out to have their bars not only off-center, but also lopsided. At present, the quality of their available images appears to be insufficient with regard to discerning the details of the bar structure.
We may certainly wonder whether the bar of the MW might be lopsided in the sense discussed in this work. Although the image of the MW bar revealed by APOGEE DR16 and Gaia DR2 is asymmetric (Queiroz et al. 2020), this is mainly due to the different extinction on both sides of the bar. We also note that the view of the MW bar that is available to us is edge-on, while the asymmetry discussed here is mainly visible in face-on images. In addition, the MW bar is known to possess a clear boxy/peanut shape (Dwek et al. 1995; Ness & Lang 2016) indicating that it must have undergone a buckling episode in the past; as discussed above, this would probably have erased any asymmetry present in the bar in the earlier stages.
Acknowledgments
I am grateful to the anonymous referee for useful comments and to the IllustrisTNG team for making their simulations publicly available.
References
- Athanassoula, E., & Misiriotis, A. 2002, MNRAS, 330, 35 [Google Scholar]
- Athanassoula, E., Machado, R. E. G., & Rodionov, S. A. 2013, MNRAS, 429, 1949 [Google Scholar]
- Bekki, K. 2009, MNRAS, 393, L60 [NASA ADS] [CrossRef] [Google Scholar]
- Besla, G., Kallivayalil, N., Hernquist, L., et al. 2012, MNRAS, 421, 2109 [Google Scholar]
- Bournaud, F., Combes, F., Jog, C. J., & Puerari, I. 2005, A&A, 438, 507 [NASA ADS] [CrossRef] [EDP Sciences] [Google Scholar]
- Buta, R. J., Sheth, K., Athanassoula, E., et al. 2015, ApJS, 217, 32 [Google Scholar]
- Collier, A., & Madigan, A.-M. 2021, ApJ, 915, 23 [NASA ADS] [CrossRef] [Google Scholar]
- Collier, A., Shlosman, I., & Heller, C. 2019, MNRAS, 489, 3102 [NASA ADS] [CrossRef] [Google Scholar]
- Debattista, V. P., Mayer, L., Carollo, C. M., et al. 2006, ApJ, 645, 209 [Google Scholar]
- Díaz-García, S., Salo, H., Laurikainen, E., & Herrera-Endoqui, M. 2016, A&A, 587, A160 [NASA ADS] [CrossRef] [EDP Sciences] [Google Scholar]
- Dwek, E., Arendt, R. G., Hauser, M. G., et al. 1995, ApJ, 445, 716 [CrossRef] [Google Scholar]
- Ebrová, I., Jílková, L., Jungwiert, B., et al. 2012, A&A, 545, A33 [NASA ADS] [CrossRef] [EDP Sciences] [Google Scholar]
- Genel, S., Fall, S. M., Hernquist, L., et al. 2015, ApJ, 804, L40 [NASA ADS] [CrossRef] [Google Scholar]
- Genel, S., Nelson, D., Pillepich, A., et al. 2018, MNRAS, 474, 3976 [Google Scholar]
- Gerin, M., Combes, F., & Athanassoula, E. 1990, A&A, 230, 37 [NASA ADS] [Google Scholar]
- Ghosh, S., Saha, K., Jog, C. J., Combes, F., & Di Matteo, P. 2021, ArXiv e-prints [arXiv:2105.05270] [Google Scholar]
- Hohl, F. 1971, ApJ, 168, 343 [NASA ADS] [CrossRef] [Google Scholar]
- Hopkins, P. F. 2015, MNRAS, 450, 53 [Google Scholar]
- Jacyszyn-Dobrzeniecka, A. M., Skowron, D. M., Mróz, P., et al. 2016, Acta Astron., 66, 149 [NASA ADS] [Google Scholar]
- Jog, C. J., & Combes, F. 2009, Phys. Rep., 471, 75 [NASA ADS] [CrossRef] [Google Scholar]
- Kruk, S. J., Lintott, C. J., Simmons, B. D., et al. 2017, MNRAS, 469, 3363 [NASA ADS] [CrossRef] [Google Scholar]
- Levine, S. E., & Sparke, L. S. 1998, ApJ, 496, L13 [NASA ADS] [CrossRef] [Google Scholar]
- Łokas, E. L. 2018, ApJ, 857, 6 [Google Scholar]
- Łokas, E. L. 2019, A&A, 629, A52 [NASA ADS] [CrossRef] [EDP Sciences] [Google Scholar]
- Łokas, E. L. 2020, A&A, 638, A133 [NASA ADS] [CrossRef] [EDP Sciences] [Google Scholar]
- Łokas, E. L. 2021, A&A, 647, A143 [NASA ADS] [CrossRef] [EDP Sciences] [Google Scholar]
- Łokas, E. L., Athanassoula, E., Debattista, V. P., et al. 2014, MNRAS, 445, 1339 [Google Scholar]
- Mapelli, M., Moore, B., & Bland-Hawthorn, J. 2008, MNRAS, 388, 697 [NASA ADS] [CrossRef] [Google Scholar]
- Marinacci, F., Vogelsberger, M., Pakmor, R., et al. 2018, MNRAS, 480, 5113 [NASA ADS] [Google Scholar]
- Martinet, L. 1984, A&A, 132, 381 [Google Scholar]
- Melvin, T., Masters, K., Lintott, C., et al. 2014, MNRAS, 438, 2882 [Google Scholar]
- Miwa, T., & Noguchi, M. 1998, ApJ, 499, 149 [Google Scholar]
- Naiman, J. P., Pillepich, A., Springel, V., et al. 2018, MNRAS, 477, 1206 [Google Scholar]
- Navarro, J. F., Frenk, C. S., & White, S. D. M. 1997, ApJ, 490, 493 [Google Scholar]
- Nelson, D., Pillepich, A., Springel, V., et al. 2018, MNRAS, 475, 624 [Google Scholar]
- Nelson, D., Springel, V., Pillepich, A., et al. 2019, Comput. Astrophys. Cosmol., 6, 2 [Google Scholar]
- Ness, M., & Lang, D. 2016, AJ, 152, 14 [NASA ADS] [CrossRef] [Google Scholar]
- Noguchi, M. 1987, MNRAS, 228, 635 [NASA ADS] [Google Scholar]
- Odewahn, S. C. 1994, AJ, 107, 1320 [NASA ADS] [CrossRef] [Google Scholar]
- Ostriker, J. P., & Peebles, P. J. E. 1973, ApJ, 186, 467 [Google Scholar]
- Pardy, S. A., D’Onghia, E., Athanassoula, E., Wilcots, E. M., & Sheth, K. 2016, ApJ, 827, 149 [CrossRef] [Google Scholar]
- Patra, N. N., & Jog, C. J. 2019, MNRAS, 488, 4942 [NASA ADS] [CrossRef] [Google Scholar]
- Peschken, N., & Łokas, E. L. 2019, MNRAS, 483, 2721 [Google Scholar]
- Pfenniger, D. 1984, A&A, 134, 373 [NASA ADS] [Google Scholar]
- Pillepich, A., Nelson, D., Hernquist, L., et al. 2018, MNRAS, 475, 648 [Google Scholar]
- Queiroz, A. B. A., Chiappini, C., Perez-Villegas, A., et al. 2020, A&A, submitted [arXiv:2007.12915] [Google Scholar]
- Rix, H.-W., & Zaritsky, D. 1995, ApJ, 447, 82 [Google Scholar]
- Rodriguez-Gomez, V., Snyder, G. F., Lotz, J. M., et al. 2019, MNRAS, 483, 4140 [NASA ADS] [CrossRef] [Google Scholar]
- Rosas-Guevara, Y., Bonoli, S., Dotti, M., et al. 2020, MNRAS, 491, 2547 [NASA ADS] [Google Scholar]
- Sellwood, J. A. 1981, A&A, 99, 362 [NASA ADS] [Google Scholar]
- Sheth, K., Elmegreen, D. M., Elmegreen, B. G., et al. 2008, ApJ, 675, 1141 [Google Scholar]
- Skibba, R. A., Masters, K. L., & Nichol, R. C. 2012, MNRAS, 423, 1485 [CrossRef] [Google Scholar]
- Springel, V. 2005, MNRAS, 364, 1105 [Google Scholar]
- Springel, V., Yoshida, N., & White, S. D. M. 2001, New Astron., 6, 79 [Google Scholar]
- Springel, V., Pakmor, R., Pillepich, A., et al. 2018, MNRAS, 475, 676 [Google Scholar]
- van der Marel, R. P. 2001, AJ, 122, 1827 [Google Scholar]
- Widrow, L. M., & Dubinski, J. 2005, ApJ, 631, 838 [Google Scholar]
- Widrow, L. M., Pym, B., & Dubinski, J. 2008, ApJ, 679, 1239 [Google Scholar]
- Zaritsky, D., Salo, H., Laurikainen, E., et al. 2013, ApJ, 772, 135 [Google Scholar]
- Zhao, D., Du, M., Ho, L. C., Debattista, V. P., & Shi, J. 2020, ApJ, 904, 170 [Google Scholar]
- Zhou, Z.-B., Zhu, W., Wang, Y., & Feng, L.-L. 2020, ApJ, 895, 92 [Google Scholar]
Appendix A: Orbits of stars in the lopsided bar
It is interesting to consider what orbits could be responsible for the asymmetry of the lopsided bar. Although the study of the detailed orbital structure is beyond the scope of the present paper, we provide here a few examples for the case of the bar forming in our simulation of the MW-like galaxy interacting with a satellite described in Section 3.1. To trace the orbits, we reran the simulation between t = 0.5 and t = 1.5 Gyr, when the asymmetry is present, saving outputs every 0.001 Gyr.
A few typical examples of orbits that may be responsible for the asymmetry are presented in Fig. A.1. The upper four panels show orbits for a fraction of the resimulated 1 Gyr to display their shapes clearly. The two lower panels show more complicated orbits for the maximum time of 1 Gyr and we see that they have not yet completed a full period. The upper two orbits are two examples familiar from the studies of Martinet (1984) and Pfenniger (1984). In the latter work, the orbits O1 and O2 in the upper row of Fig. A.1 were called P and C, respectively, and classified as bifurcations of the standard x1 family. From the two lower rows of Fig. A.1, we see that there are many more types of orbits and of much more complicated shapes contributing to the formation of a lopsided bar.
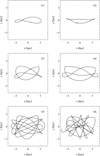 |
Fig. A.1. Examples of stellar orbits from the simulation of the interacting MW contributing to the lopsided shape of the bar. The orbits were transformed to the reference frame of the bar and are shown in the face-on view with the x axis along the bar. |
All Tables
All Figures
|
Fig. 1. Surface density distribution of the stellar components of the lopsided bars from IllustrisTNG, in the face-on view at the present time. The surface density, Σ, is normalized to the central maximum value in each case and the contours are equally spaced in logΣ. |
| In the text | |
|
Fig. 2. Profiles of bar mode A2(R) (left panel), the phase of the bar mode ϕ2(R) (middle panel), and the m = 4 mode A4(R) (right panel) for IllustrisTNG galaxies with lopsided bars at the present time. Measurements were carried out in bins of ΔR = 0.5 kpc. |
| In the text | |
|
Fig. 3. Evolution of the shape of the lopsided bars from IllustrisTNG. Blue and red lines plot the intermediate to longest b/a and the shortest to longest c/a axis ratios, respectively. Green and black lines show the evolution of the triaxiality parameter, T, and the bar mode, A2. Vertical gray lines indicate the times of bar formation. |
| In the text | |
|
Fig. 4. Odd Fourier modes of the stellar component of IllustrisTNG galaxies measured within two stellar half-mass radii, 2r1/2, as function of time. The red, green, blue, and black lines show the results for m = 1, 3, 5, and 7, respectively. Vertical gray lines indicate the times of bar formation. |
| In the text | |
|
Fig. 5. Evolution of the profiles Am(R) over time for galaxy ID250397 from IllustrisTNG. The five panels from top to bottom show the results for m = 1–5. |
| In the text | |
|
Fig. 6. Evolution of the profiles Am(R) over time for galaxy ID511905 from IllustrisTNG. The five panels from top to bottom show the results for m = 1–5. |
| In the text | |
|
Fig. 7. Surface density distributions in the face-on view of the stellar components of the MW-like galaxies in the controlled simulations. The coordinate system is that of the simulation box, with the galaxy disk always in the XY plane. In all images, the galaxy is rotating counter-clockwise. The three upper panels show three stages of the evolution for the MW interacting with a satellite and the three lower panels three stages of the simulation of the MW with an off-center disk. The initial configurations are presented in the left-column plots. The surface density, Σ, is normalized to the central maximum value in each case and the contours are equally spaced in logΣ. |
| In the text | |
|
Fig. 8. Results of controlled simulations of the formation of lopsided bars in MW-like galaxies. Upper panels: evolution of the shape of the interacting MW (left) and the MW with an off-center disk (right). The blue and red lines plot the intermediate to longest b/a and the shortest to longest c/a axis ratios, respectively. The green and black lines show the evolution of the triaxiality parameter T and the bar mode A2. Lower panels: odd Fourier modes of the stellar component of the interacting MW (left) and the MW with an off-center disk (right) as a function of time. The red, green, blue, and black lines show the results for m = 1, 3, 5, and 7, respectively. In all panels, the vertical gray line indicates the time of bar formation. |
| In the text | |
|
Fig. 9. Evolution of the profiles Am(R) over time for the controlled simulation of the interacting MW. The five panels from top to bottom show the results for m = 1–5. |
| In the text | |
|
Fig. 10. Evolution of the profiles Am(R) over time for the controlled simulation of the MW with the off-center disk. The five panels from top to bottom show the results for m = 1–5. |
| In the text | |
|
Fig. A.1. Examples of stellar orbits from the simulation of the interacting MW contributing to the lopsided shape of the bar. The orbits were transformed to the reference frame of the bar and are shown in the face-on view with the x axis along the bar. |
| In the text | |
Current usage metrics show cumulative count of Article Views (full-text article views including HTML views, PDF and ePub downloads, according to the available data) and Abstracts Views on Vision4Press platform.
Data correspond to usage on the plateform after 2015. The current usage metrics is available 48-96 hours after online publication and is updated daily on week days.
Initial download of the metrics may take a while.