Fig. 8.
Download original image
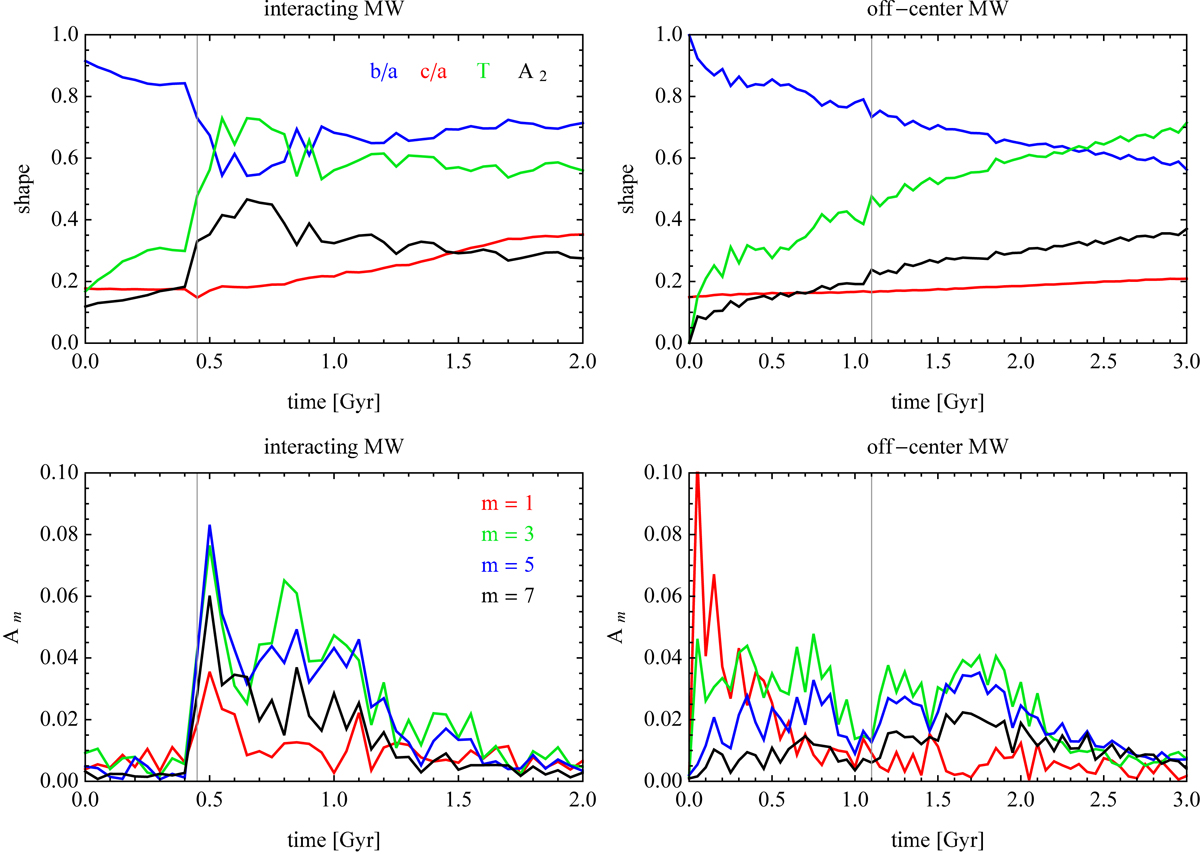
Results of controlled simulations of the formation of lopsided bars in MW-like galaxies. Upper panels: evolution of the shape of the interacting MW (left) and the MW with an off-center disk (right). The blue and red lines plot the intermediate to longest b/a and the shortest to longest c/a axis ratios, respectively. The green and black lines show the evolution of the triaxiality parameter T and the bar mode A2. Lower panels: odd Fourier modes of the stellar component of the interacting MW (left) and the MW with an off-center disk (right) as a function of time. The red, green, blue, and black lines show the results for m = 1, 3, 5, and 7, respectively. In all panels, the vertical gray line indicates the time of bar formation.
Current usage metrics show cumulative count of Article Views (full-text article views including HTML views, PDF and ePub downloads, according to the available data) and Abstracts Views on Vision4Press platform.
Data correspond to usage on the plateform after 2015. The current usage metrics is available 48-96 hours after online publication and is updated daily on week days.
Initial download of the metrics may take a while.