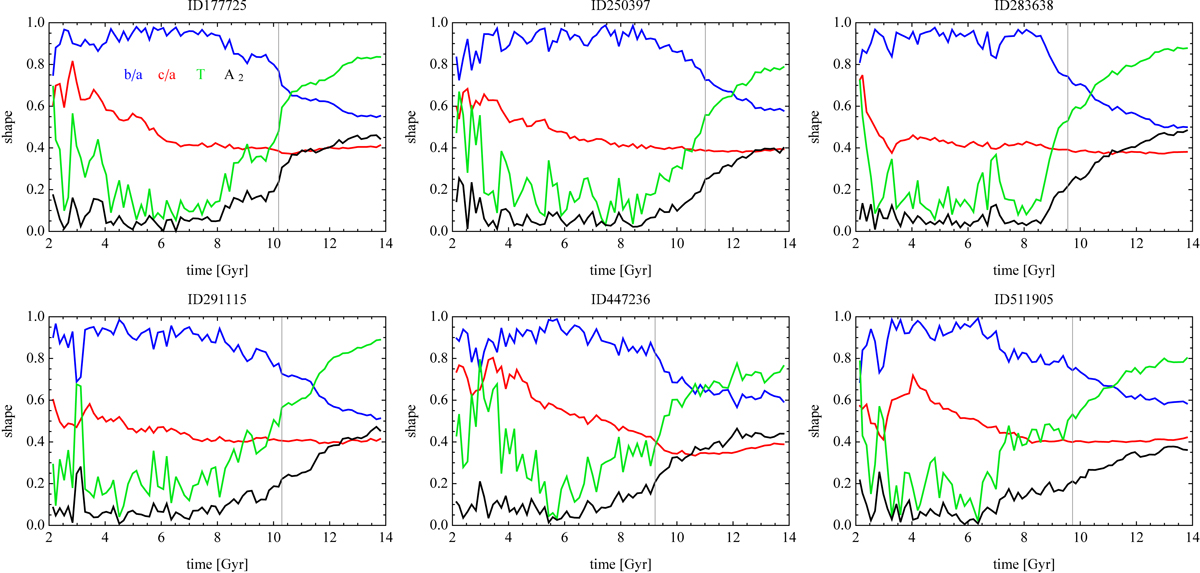
Fig. 3.
Download original image
Evolution of the shape of the lopsided bars from IllustrisTNG. Blue and red lines plot the intermediate to longest b/a and the shortest to longest c/a axis ratios, respectively. Green and black lines show the evolution of the triaxiality parameter, T, and the bar mode, A2. Vertical gray lines indicate the times of bar formation.
Current usage metrics show cumulative count of Article Views (full-text article views including HTML views, PDF and ePub downloads, according to the available data) and Abstracts Views on Vision4Press platform.
Data correspond to usage on the plateform after 2015. The current usage metrics is available 48-96 hours after online publication and is updated daily on week days.
Initial download of the metrics may take a while.