Fig. 5.
Download original image
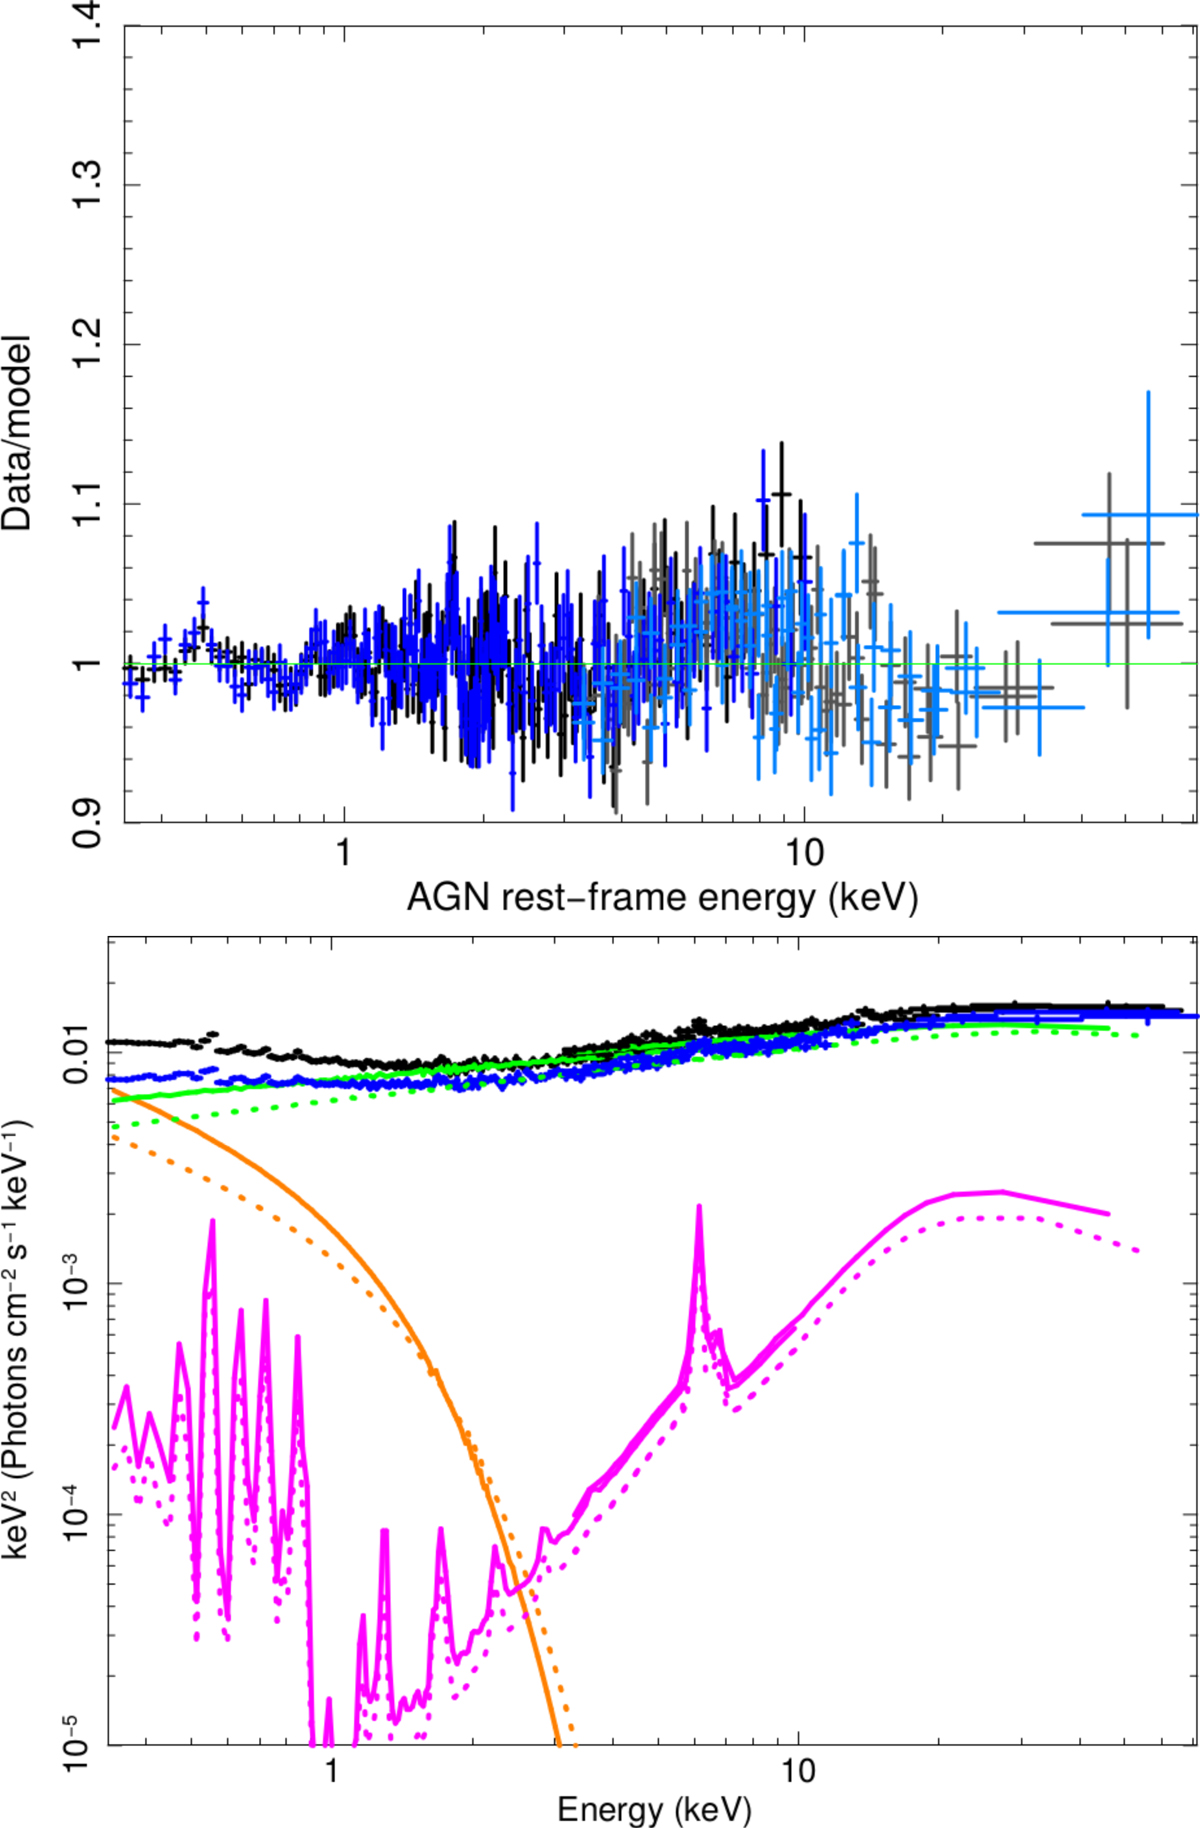
Fit of the two simultaneous 2019 and 2020 XMM-Newton/pn and NuSTAR spectra with the TBNEW(GAL) × [COMPTT(WARM) + REFLKERR(HOT) + REFLKERR(REFL)] model. The fit parameters are reported in Table 3. Top panel: data-to-model ratio. Black: 2019 XMM-Newton/pn; dark grey: 2019 NuSTAR; blue: 2020 XMM-Newton/pn; light blue: 2020 NuSTAR. The Y-axis range is identical to that of Fig. 4 to allow for a direct comparison. Bottom panel: unfolded unabsorbed spectra (black: 2019; blue: 2020), where the separate contributions of the model components are displayed (solid and dotted curves for 2019 and 2020, respectively): Orange: soft Comptonisation (warm corona); green: hard Comptonisation (hot corona); magenta: disc reflection component.
Current usage metrics show cumulative count of Article Views (full-text article views including HTML views, PDF and ePub downloads, according to the available data) and Abstracts Views on Vision4Press platform.
Data correspond to usage on the plateform after 2015. The current usage metrics is available 48-96 hours after online publication and is updated daily on week days.
Initial download of the metrics may take a while.