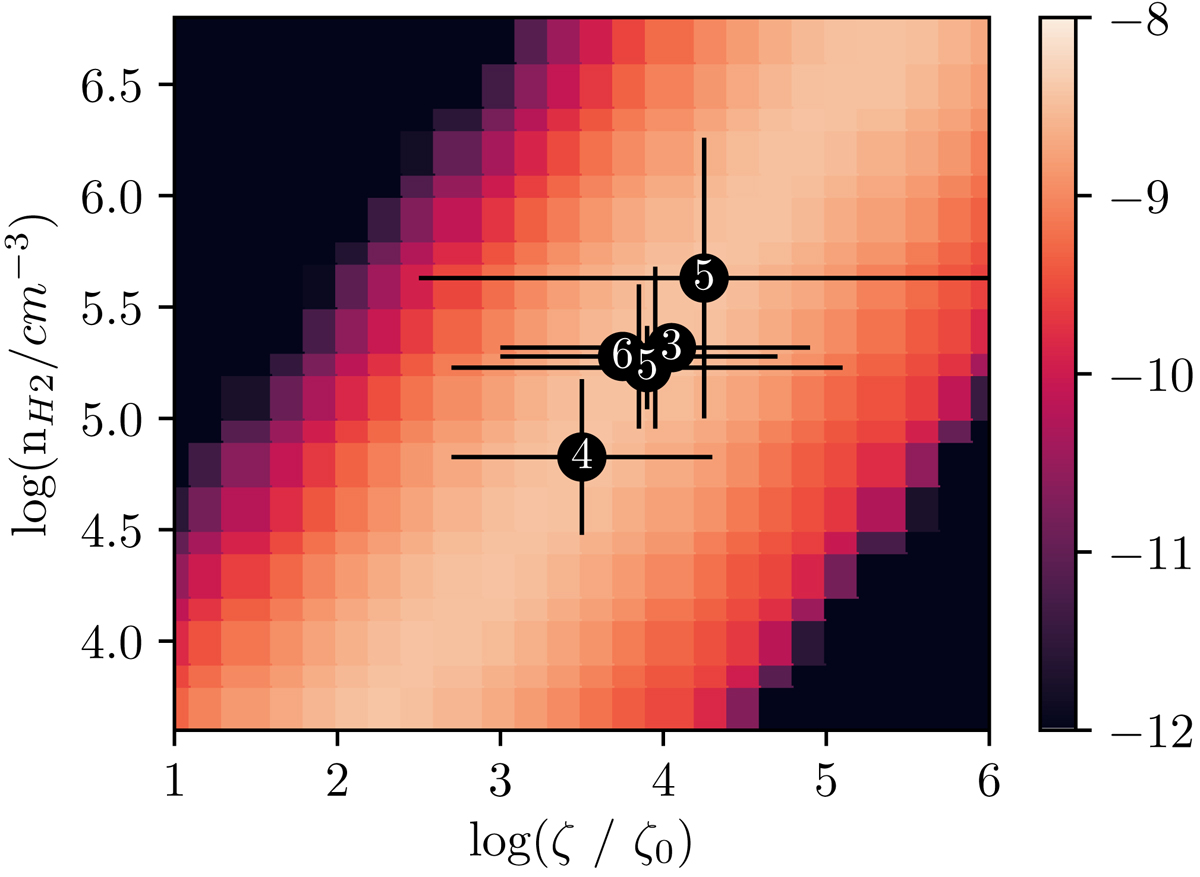
Fig. 8.
Download original image
Steady state C2H abundance shown in colour scale as a function of gas density and cosmic-ray ionization rate in units of ζ0 = 1.3 × 10⁻¹⁷ s−1. The values given are a median over different gas temperatures. Each point represents a GMC with the vertical lines showing the upper and lower limits on the density for that cloud. The horizontal lines span the cosmic-ray ionization rate values that give abundances within the measured range for those density values. GMC 7 does not appear on this diagram as no model produces a large enough abundance of C2H to match even its observed lower-limit.
Current usage metrics show cumulative count of Article Views (full-text article views including HTML views, PDF and ePub downloads, according to the available data) and Abstracts Views on Vision4Press platform.
Data correspond to usage on the plateform after 2015. The current usage metrics is available 48-96 hours after online publication and is updated daily on week days.
Initial download of the metrics may take a while.