Fig. 6.
Download original image
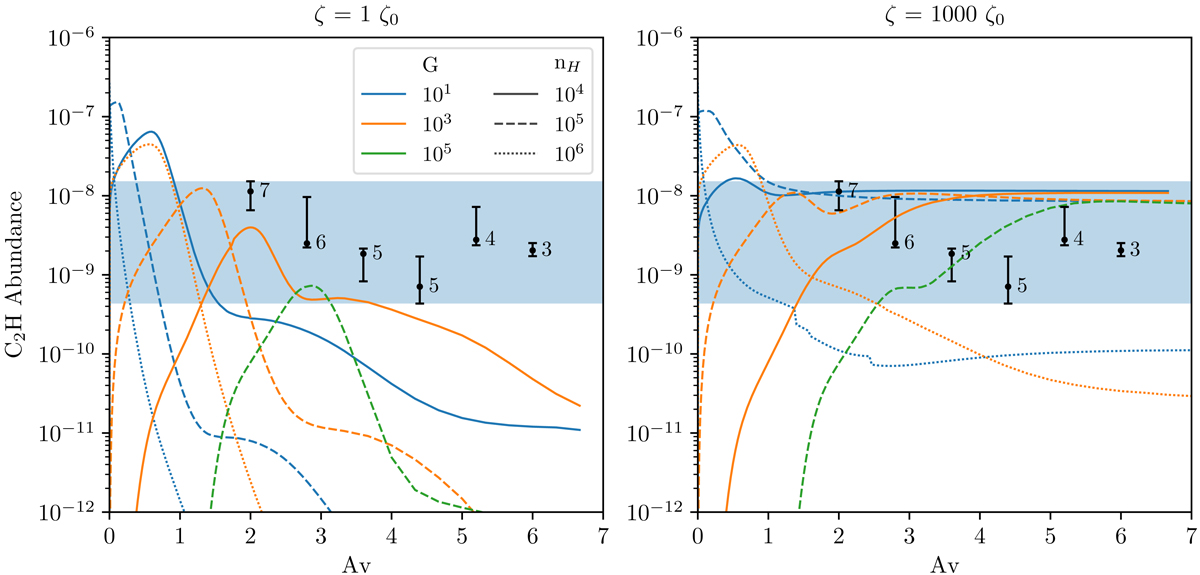
Fractional abundance as a function of depth into the cloud from PDR modeling and observations. The depth into the cloud is given as the equivalent visual extinction. The black dots are numbered according to the GMC they represent and error bars show the observed abundance towards that GMC, their position on the x-axis is arbitrary and does not represent the cloud sizes. The lines show UCL_PDR models with different parameters. The shaded band covers the abundance range of all GMC measurements. In the low cosmic-ray ionization rate models (left), the abundance decreases with distance into the cloud so the total column density is less than the observed column density despite the high abundances reached at low Av.
Current usage metrics show cumulative count of Article Views (full-text article views including HTML views, PDF and ePub downloads, according to the available data) and Abstracts Views on Vision4Press platform.
Data correspond to usage on the plateform after 2015. The current usage metrics is available 48-96 hours after online publication and is updated daily on week days.
Initial download of the metrics may take a while.