Fig. 5.
Download original image
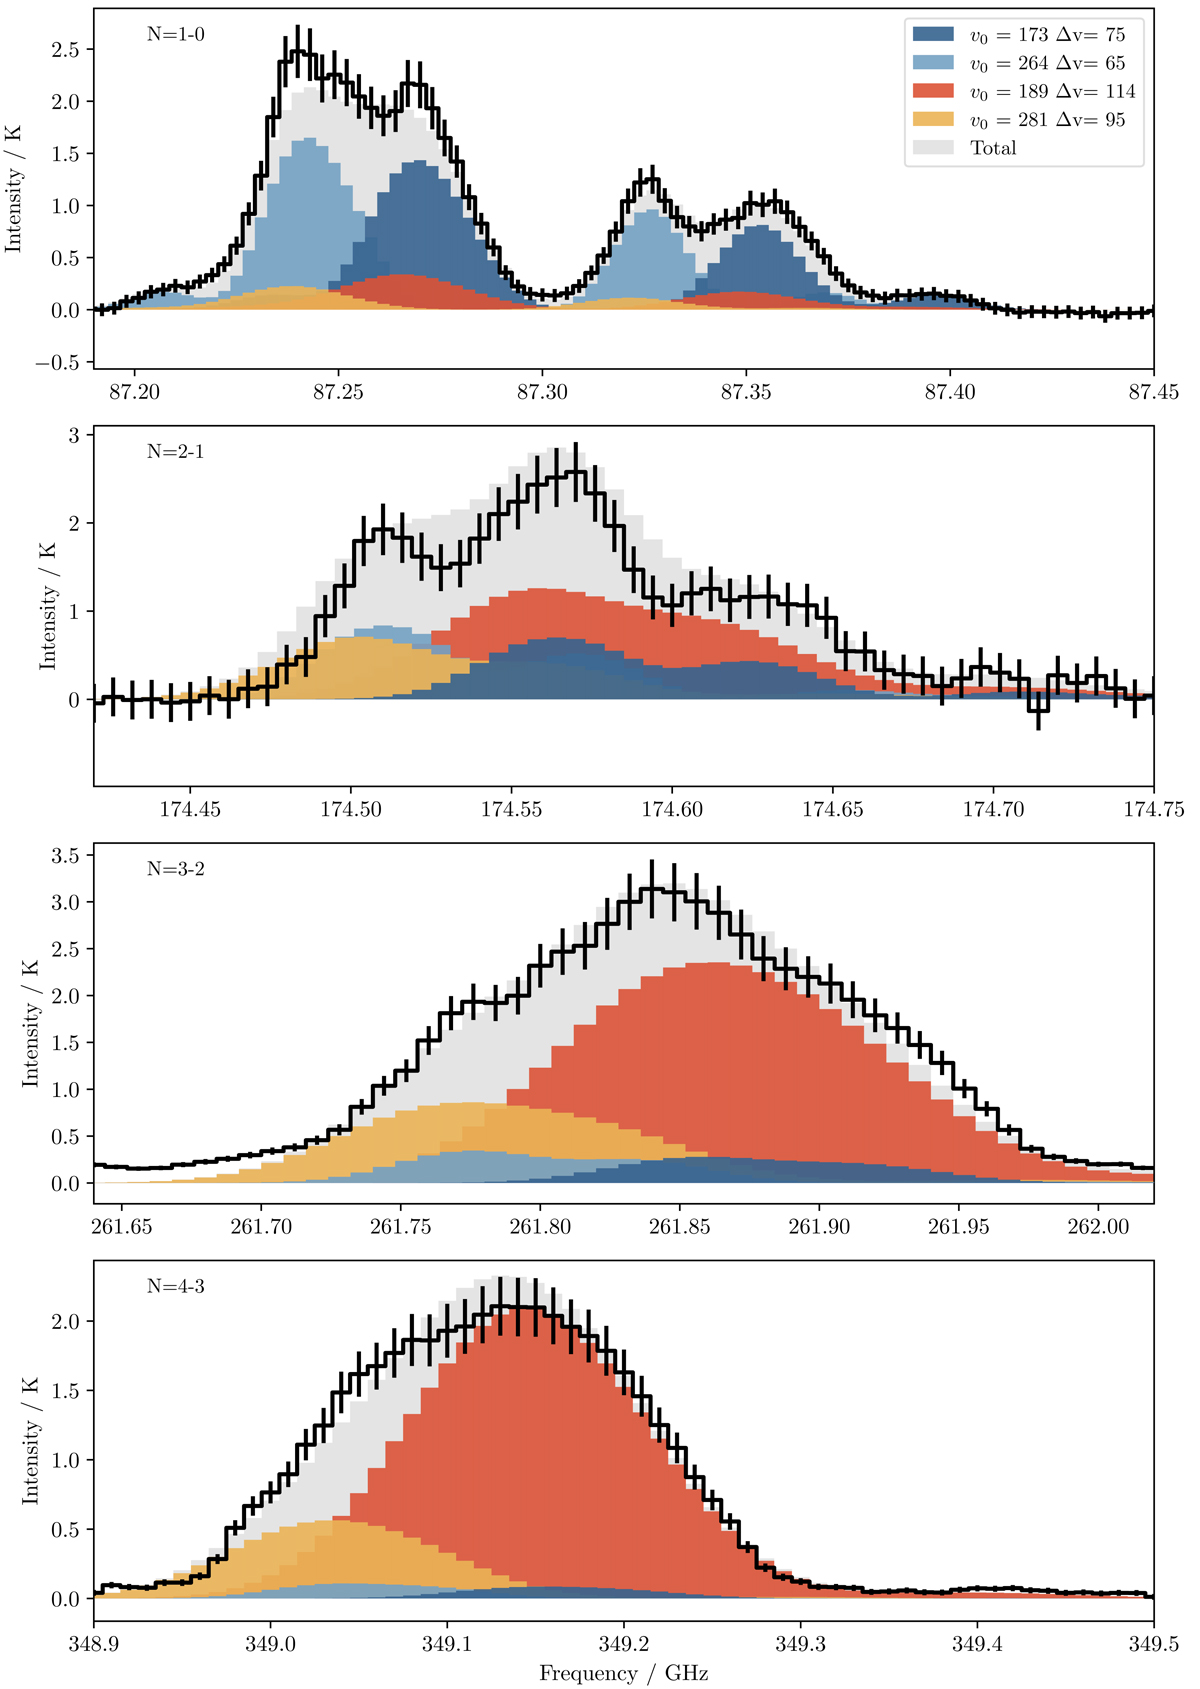
Best fit model for GMC 5. The black trace shows the measured spectra with error bars. The histograms show the spectral model components in colour and their total in grey. The legend gives the central velocity (V0) and linewidth (ΔV) of each component. The two blue components are the low density CMZ contribution and the others are the high density GMC components.
Current usage metrics show cumulative count of Article Views (full-text article views including HTML views, PDF and ePub downloads, according to the available data) and Abstracts Views on Vision4Press platform.
Data correspond to usage on the plateform after 2015. The current usage metrics is available 48-96 hours after online publication and is updated daily on week days.
Initial download of the metrics may take a while.