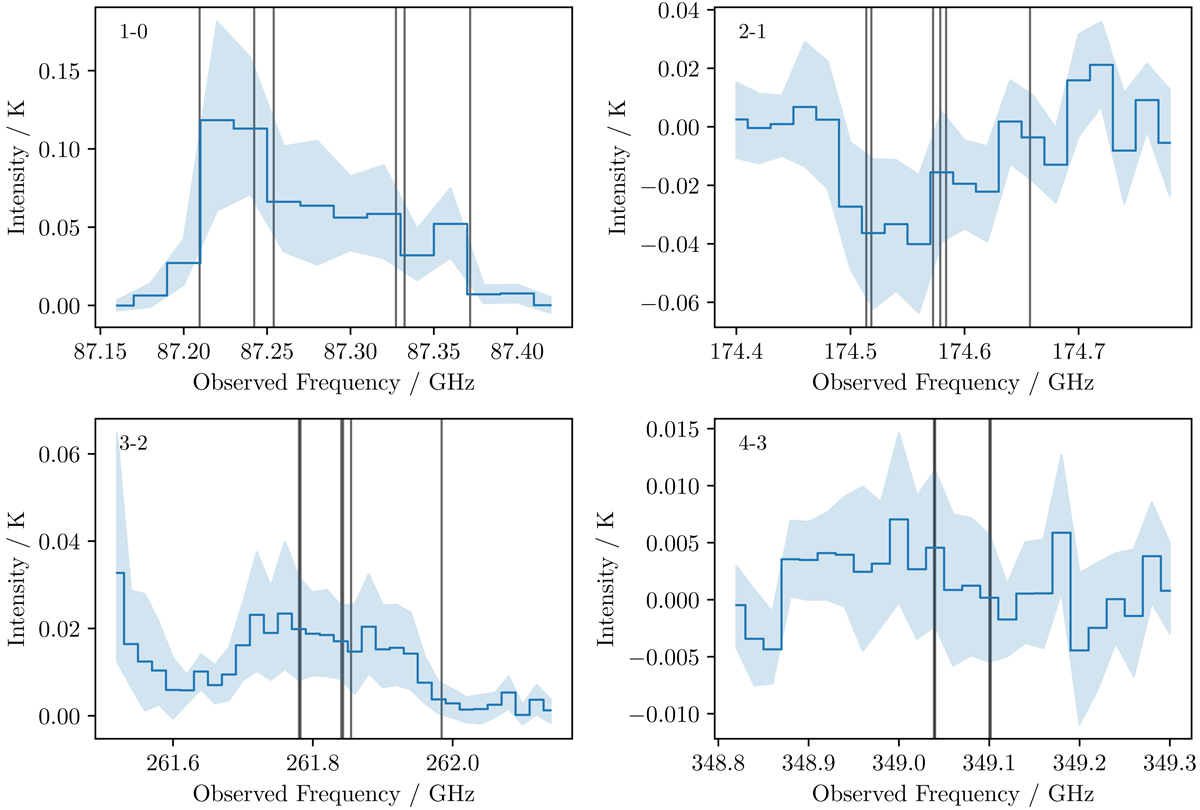
Fig. 3.
Download original image
Median stack of all spectra sampled from the extended region of the CMZ. The median is shown as a line and the shaded region gives the 95% confidence interval on this value. The black squares in Fig. 2 indicate the positions from which spectra were extracted for this composite spectrum. The black lines indicate the positions of the C2H components in each N transition, Doppler shifted by 255 km s−1, the LSR velocity of NGC 253.
Current usage metrics show cumulative count of Article Views (full-text article views including HTML views, PDF and ePub downloads, according to the available data) and Abstracts Views on Vision4Press platform.
Data correspond to usage on the plateform after 2015. The current usage metrics is available 48-96 hours after online publication and is updated daily on week days.
Initial download of the metrics may take a while.