Free Access
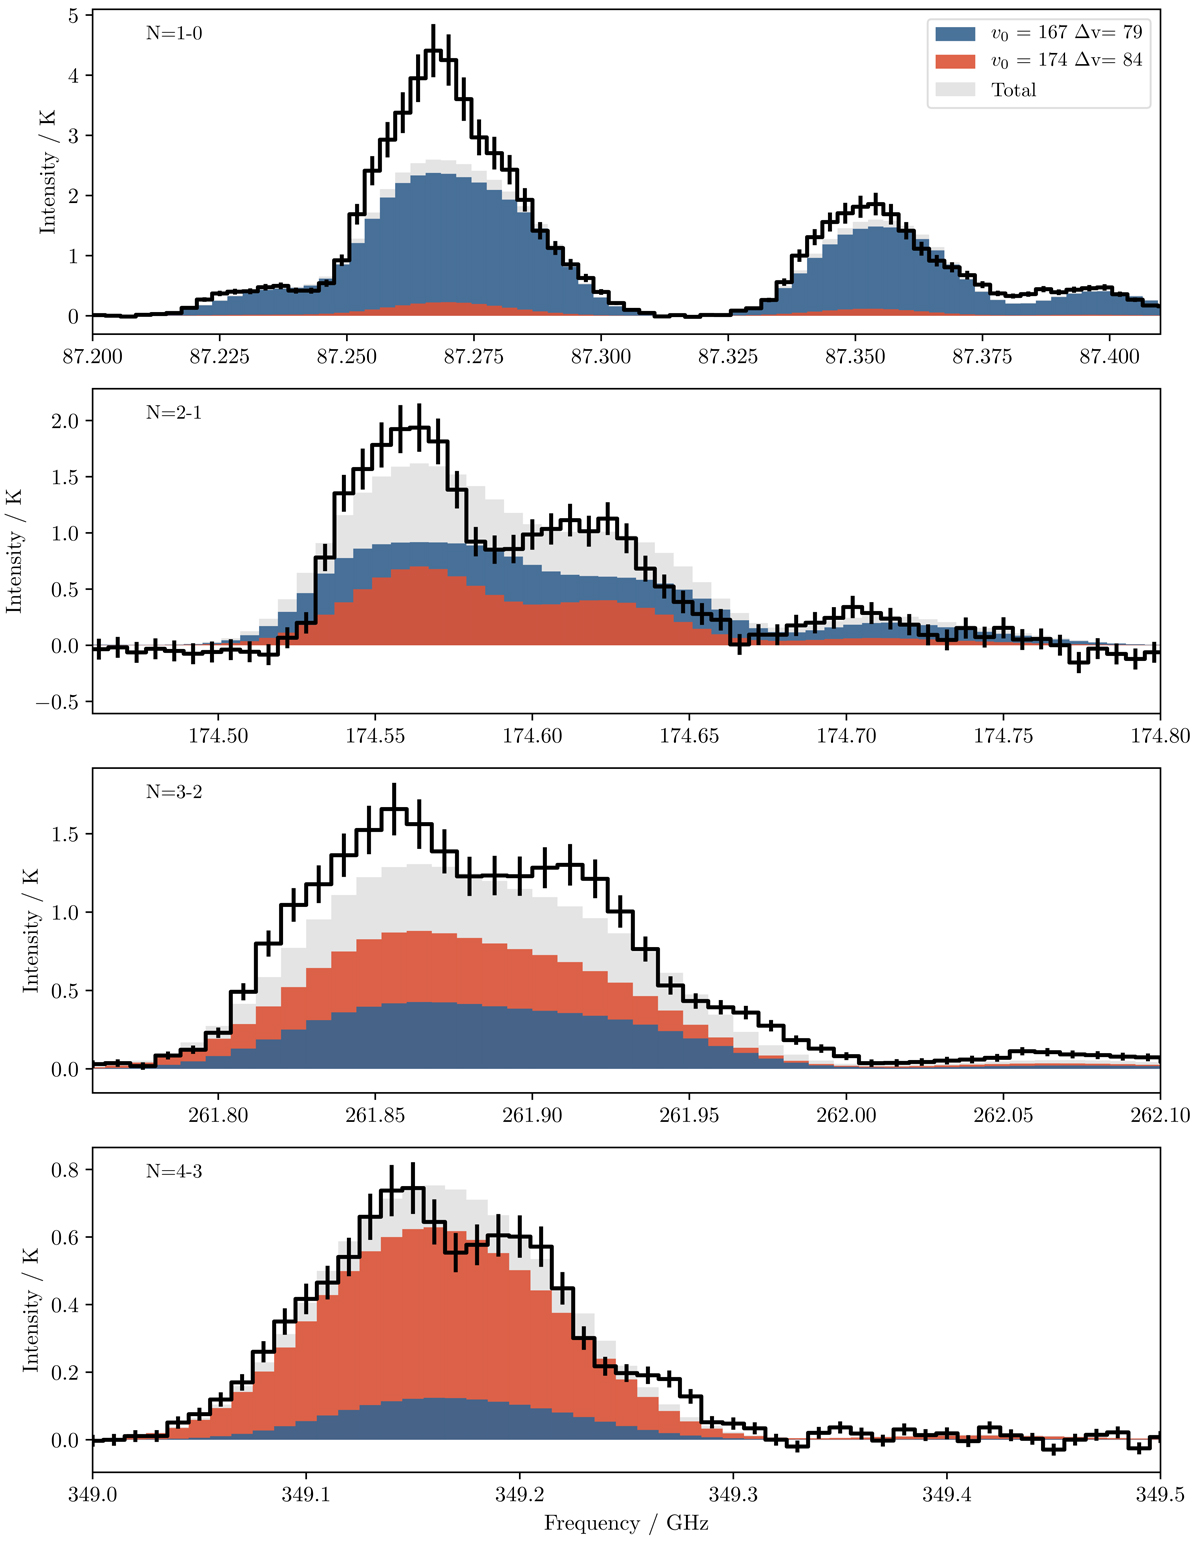
Fig. B.1.
Download original image
Measured spectrum from GMC 7 in black with error bars. Model spectra generated from most likely values for GMC 7 as filled histograms. The blue component shows the low density extended emission, the red shows the high density GMC emission, and the grey shows the complete model.
Current usage metrics show cumulative count of Article Views (full-text article views including HTML views, PDF and ePub downloads, according to the available data) and Abstracts Views on Vision4Press platform.
Data correspond to usage on the plateform after 2015. The current usage metrics is available 48-96 hours after online publication and is updated daily on week days.
Initial download of the metrics may take a while.