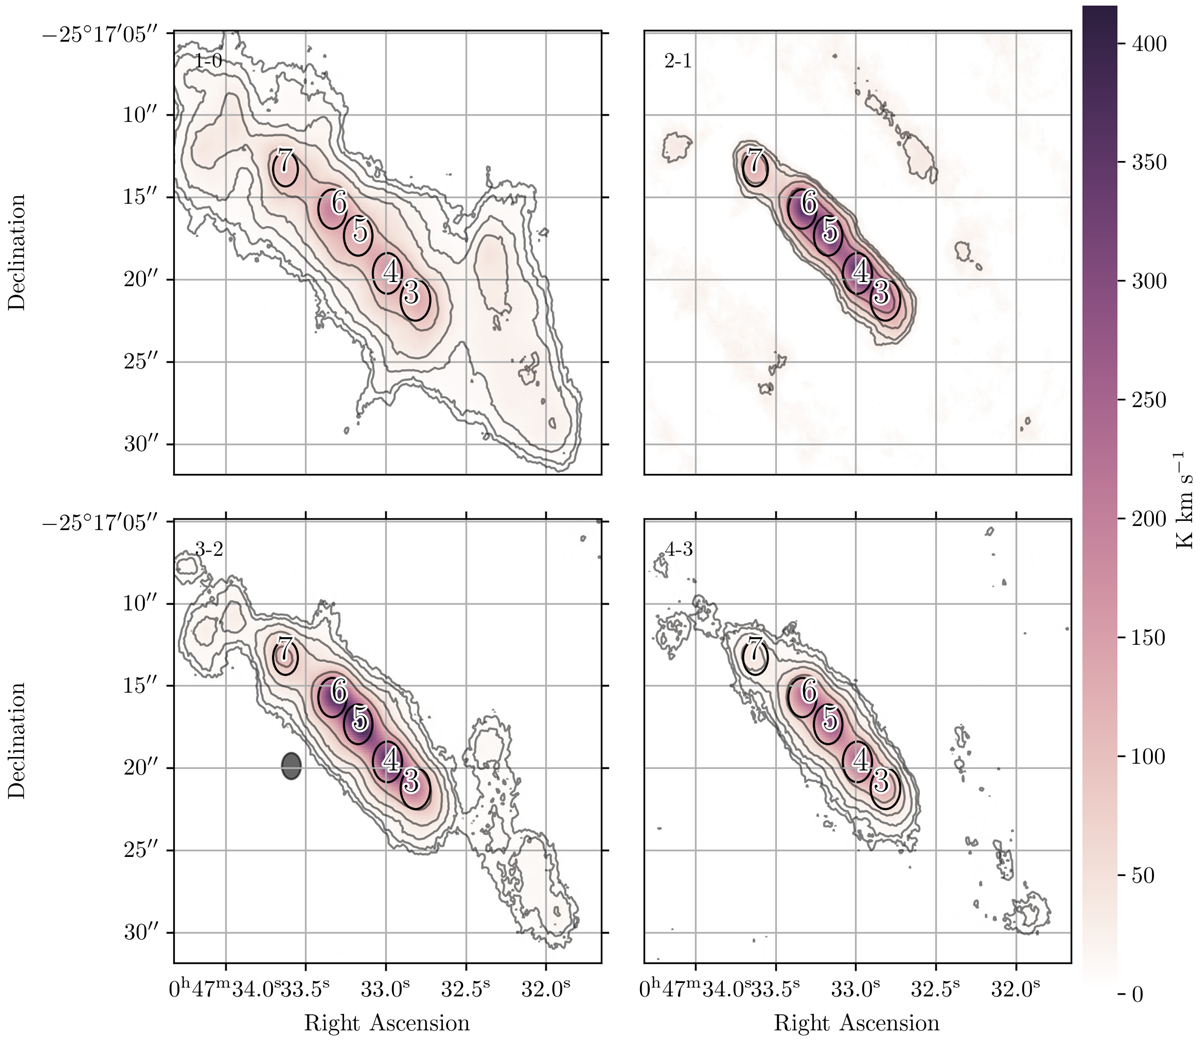
Fig. 1.
Download original image
Integrated emission maps of C2H in NGC 253. The beam size for all panels is 1.6″ and is shown in the bottom left panel. Since the beam size is shared, the wider spatial distribution of the N = 1−0 emission is not caused by a beam size effect. Contours at the 3, 5, 10, 20 and 50σ level are drawn in black. The noise levels in order of increasing N are 1.4, 8.5, 2.0 and 1.6 K km s−1. Each ellipse shows the position and size of the Gaussian fits to the four individual clumps described in Sect. 3.1. The numbers indicate the position of the GMCs in Leroy et al. (2015).
Current usage metrics show cumulative count of Article Views (full-text article views including HTML views, PDF and ePub downloads, according to the available data) and Abstracts Views on Vision4Press platform.
Data correspond to usage on the plateform after 2015. The current usage metrics is available 48-96 hours after online publication and is updated daily on week days.
Initial download of the metrics may take a while.