Fig. 4
Download original image
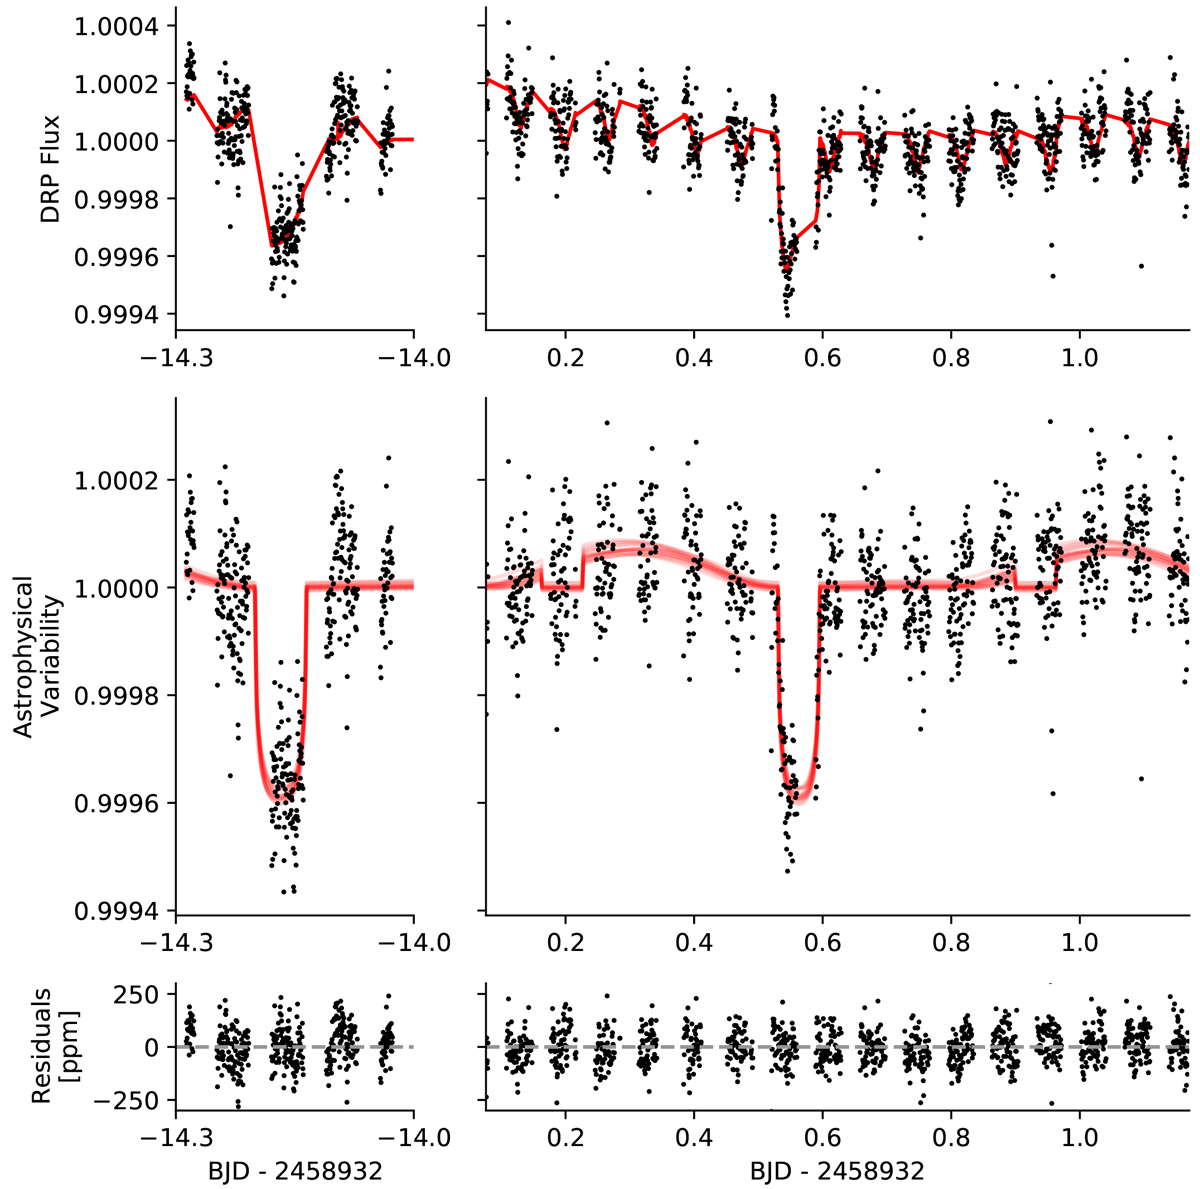
Detrended CHEOPS photometry of 55 Cnc e. Upper: the Data Reduction Pipeline (DRP) aperture photometry fluxes in black, and in red the best-fit linear combination of a transit model, a piecewise-Lambertian phase variation, and several detrending vectors. This fit is used to infer the best-fit transit parameters. The left column shows transit observations obtained during the in-orbit commissioning (IOC) phase, and the right column shows the phase curve observation. Middle: the residuals after the instrumental and systematic variations have been removed (black) and several draws from the posterior distributions for the transit and phase curve parameters (red). Lower: the residuals after removing allsystematics and astrophysical signals from the observations.
Current usage metrics show cumulative count of Article Views (full-text article views including HTML views, PDF and ePub downloads, according to the available data) and Abstracts Views on Vision4Press platform.
Data correspond to usage on the plateform after 2015. The current usage metrics is available 48-96 hours after online publication and is updated daily on week days.
Initial download of the metrics may take a while.