Fig. 2
Download original image
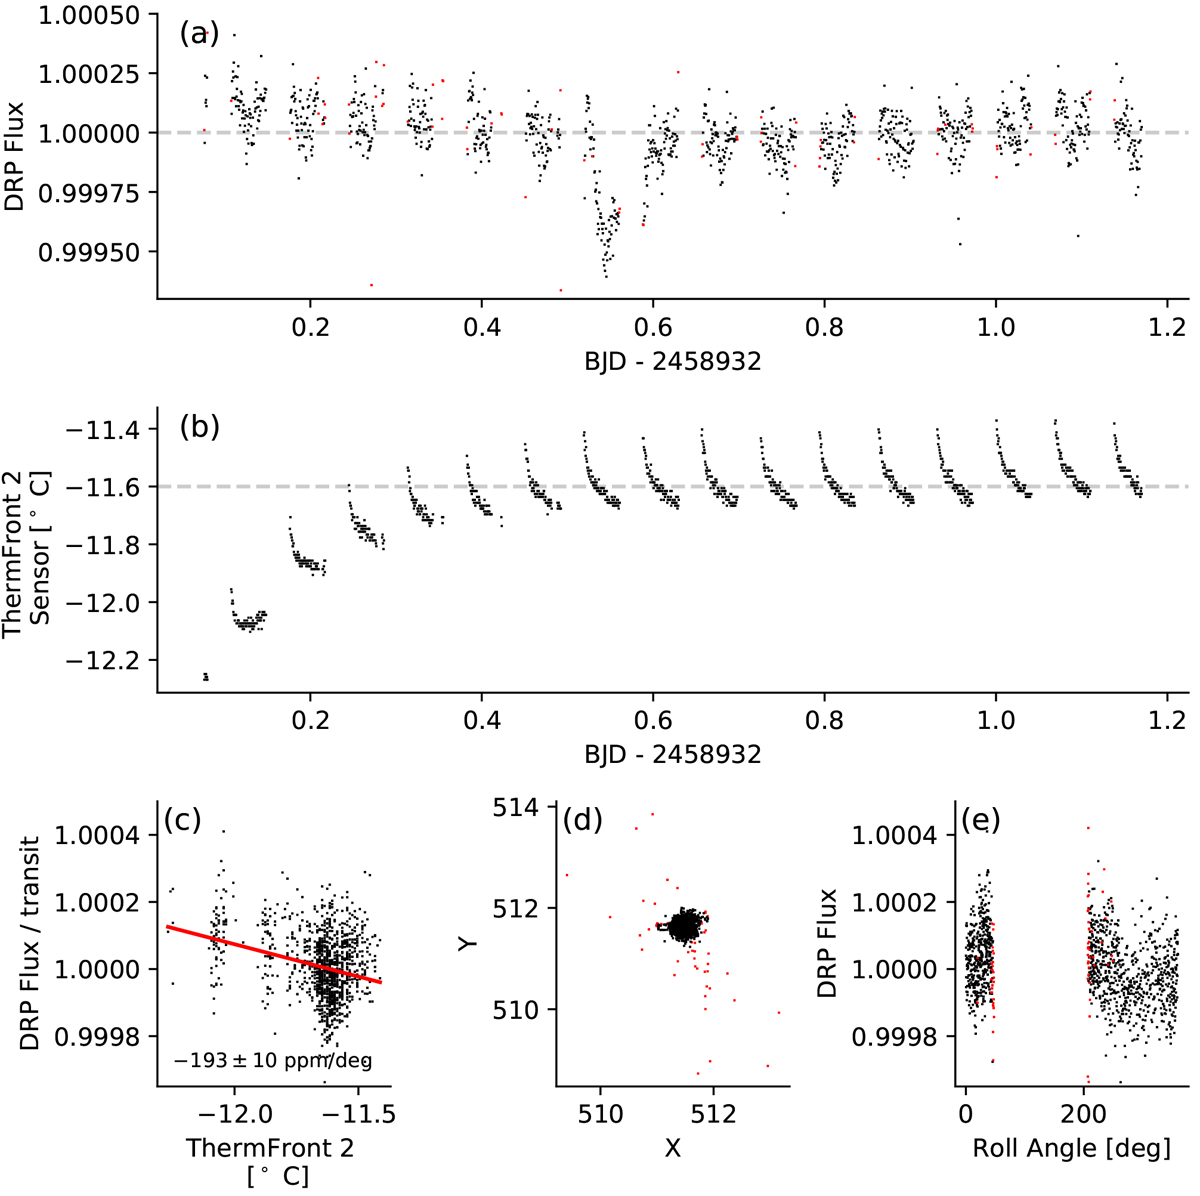
Photometry from CHEOPS of 55 Cnc e and detrending vectors. (a) Raw fluxes returned by the Data Reduction Pipeline (DRP) aperture photometry observations over the 1.6 orbital phases of 55 Cnc e, centered on a transit. Red points are centroid outliers and are masked from analysis. The gaps in the observations occur primarily when Earth is occulting the target star. The horizontal dashed line at flux unity represents the median flux, about which we see variations in flux in the phase curve. (b) One component of the variations in the raw phase curve in panel a is a “ramp” feature which is anticorrelated with the telescope tube temperature, denoted the “ThermFront 2 Sensor” temperature. A full discussion of the link between the flux variations and telescope tube temperature is written in Sect. 3.3. The temperature of the telescope tube rises asymptotically from a minimum at the beginning of the observations to a near-constant value after ~ 0.5 days. There is an additional perturbation in the temperature once per orbit, thought to be caused by illumination of the telescope optical assembly by the Earth during occultation. (c) Changes in the DRP flux are associated with changes in the ThermFront 2 Sensor temperature after dividing out the transit with a slope of − 193 ± 10 ppm/degree Celsius. (d)Measured centroid of the target star on the detector in pixel units – outliers in red are masked from further analysis. (e) Trends in DRP flux with roll angle after correction for smearing (see Sect. 3.2) are ≲ 100 ppm, and are a result of correlations between the spacecraft roll angle and the contamination from nearby stars, and in the background light (see Sect. 3.2). Red points are the masked centroid outliers, which mostly occur immediately before and after the Earth occultation.
Current usage metrics show cumulative count of Article Views (full-text article views including HTML views, PDF and ePub downloads, according to the available data) and Abstracts Views on Vision4Press platform.
Data correspond to usage on the plateform after 2015. The current usage metrics is available 48-96 hours after online publication and is updated daily on week days.
Initial download of the metrics may take a while.