Free Access
Fig. B.4
Download original image
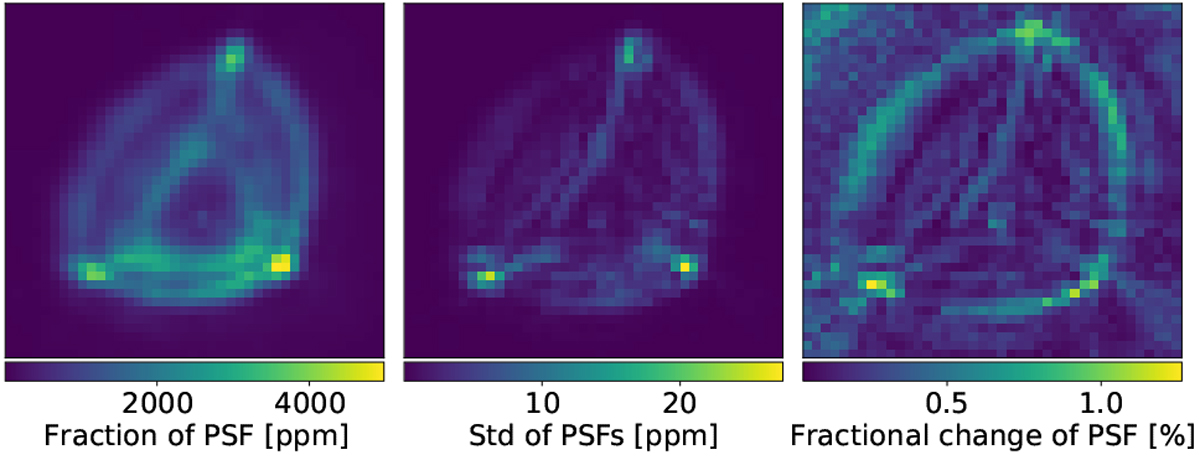
CHEOPS PSF and its changes over the 55 Cnc e visit. The left panel shows the mean PSF, the central panel shows the standard deviation of the PSF per pixel over the duration of the visit, and the right panel shows the fractional change of the PSF per pixel.
Current usage metrics show cumulative count of Article Views (full-text article views including HTML views, PDF and ePub downloads, according to the available data) and Abstracts Views on Vision4Press platform.
Data correspond to usage on the plateform after 2015. The current usage metrics is available 48-96 hours after online publication and is updated daily on week days.
Initial download of the metrics may take a while.