Fig. 1
Download original image
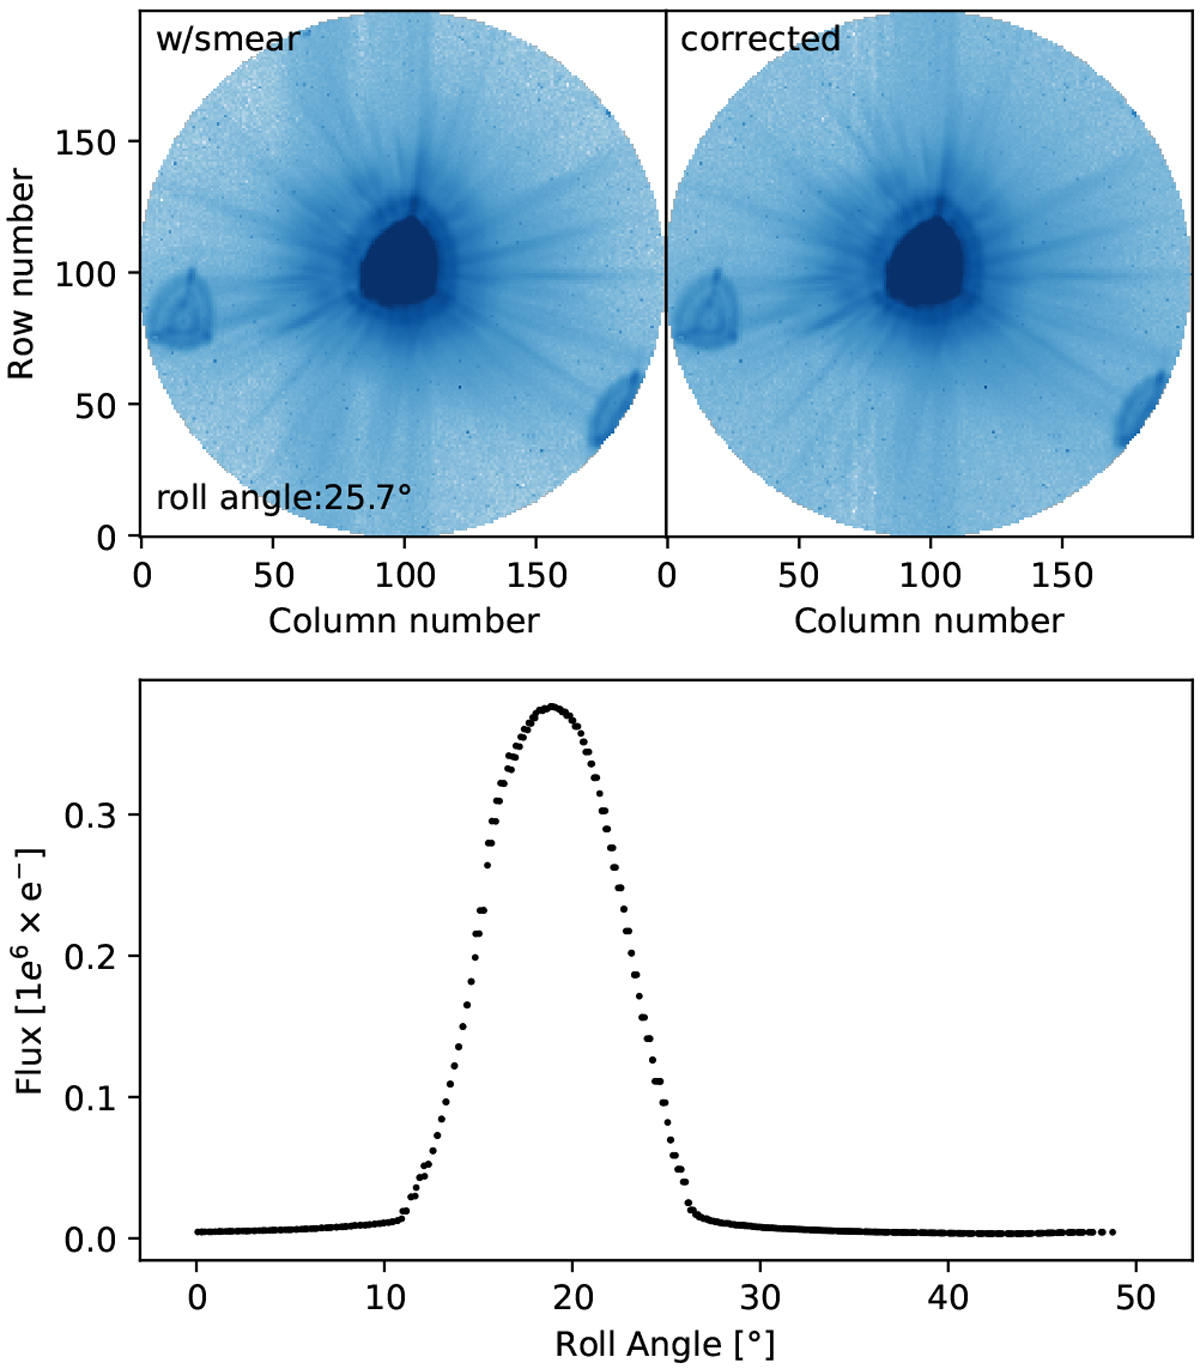
Smear contamination correction. Top-left: an example CHEOPS exposure where the smear contamination from 53 Cnc, located outside the subarray image, is visible at the left of 55 Cnc (the star at the center of the field of view). Top-right: the same frame after the DRP v12 smear correction. Bottom: the estimated smear contamination flux within the DEFAULT aperture as a function of the observation roll angle which affects each orbit.
Current usage metrics show cumulative count of Article Views (full-text article views including HTML views, PDF and ePub downloads, according to the available data) and Abstracts Views on Vision4Press platform.
Data correspond to usage on the plateform after 2015. The current usage metrics is available 48-96 hours after online publication and is updated daily on week days.
Initial download of the metrics may take a while.