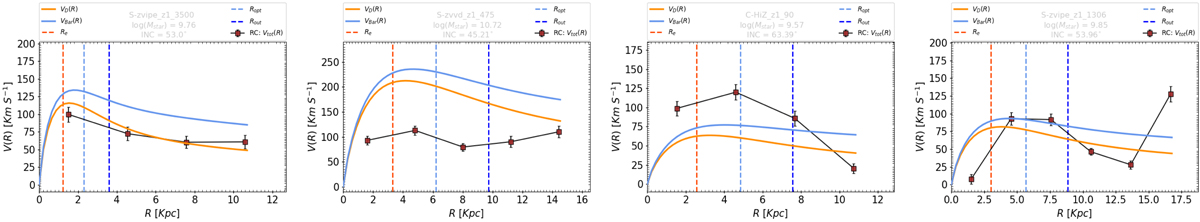
Fig. D.1.
Download original image
Few example RCs for which either dynamical masses are unexpected or are a DM fraction. The color codes are as follows: Observed RC is shown by brown squares with the error bars connected with a black line; the orange and blue curves indicate the stellar and baryonic mass velocity curves derived assuming Freeman (1970) disk for given total M* and Mbar. The vertical red, light blue, and dashed blue lines represent the Re, Ropt, and Rout respectively. From left to right: first and second type of RCs seem to have either overestimated baryonic mass or wrong RC, which leads to smaller dynamical masses than baronic masses, and thus a negative DM fraction. The third type of RCs are announced declining, thus giving us fDM(<Ropt) > fDM(<Rout), which is generally not seen in the local SFGs. The fourth type of RCs are disturbed, thus discarded from the analysis.
Current usage metrics show cumulative count of Article Views (full-text article views including HTML views, PDF and ePub downloads, according to the available data) and Abstracts Views on Vision4Press platform.
Data correspond to usage on the plateform after 2015. The current usage metrics is available 48-96 hours after online publication and is updated daily on week days.
Initial download of the metrics may take a while.