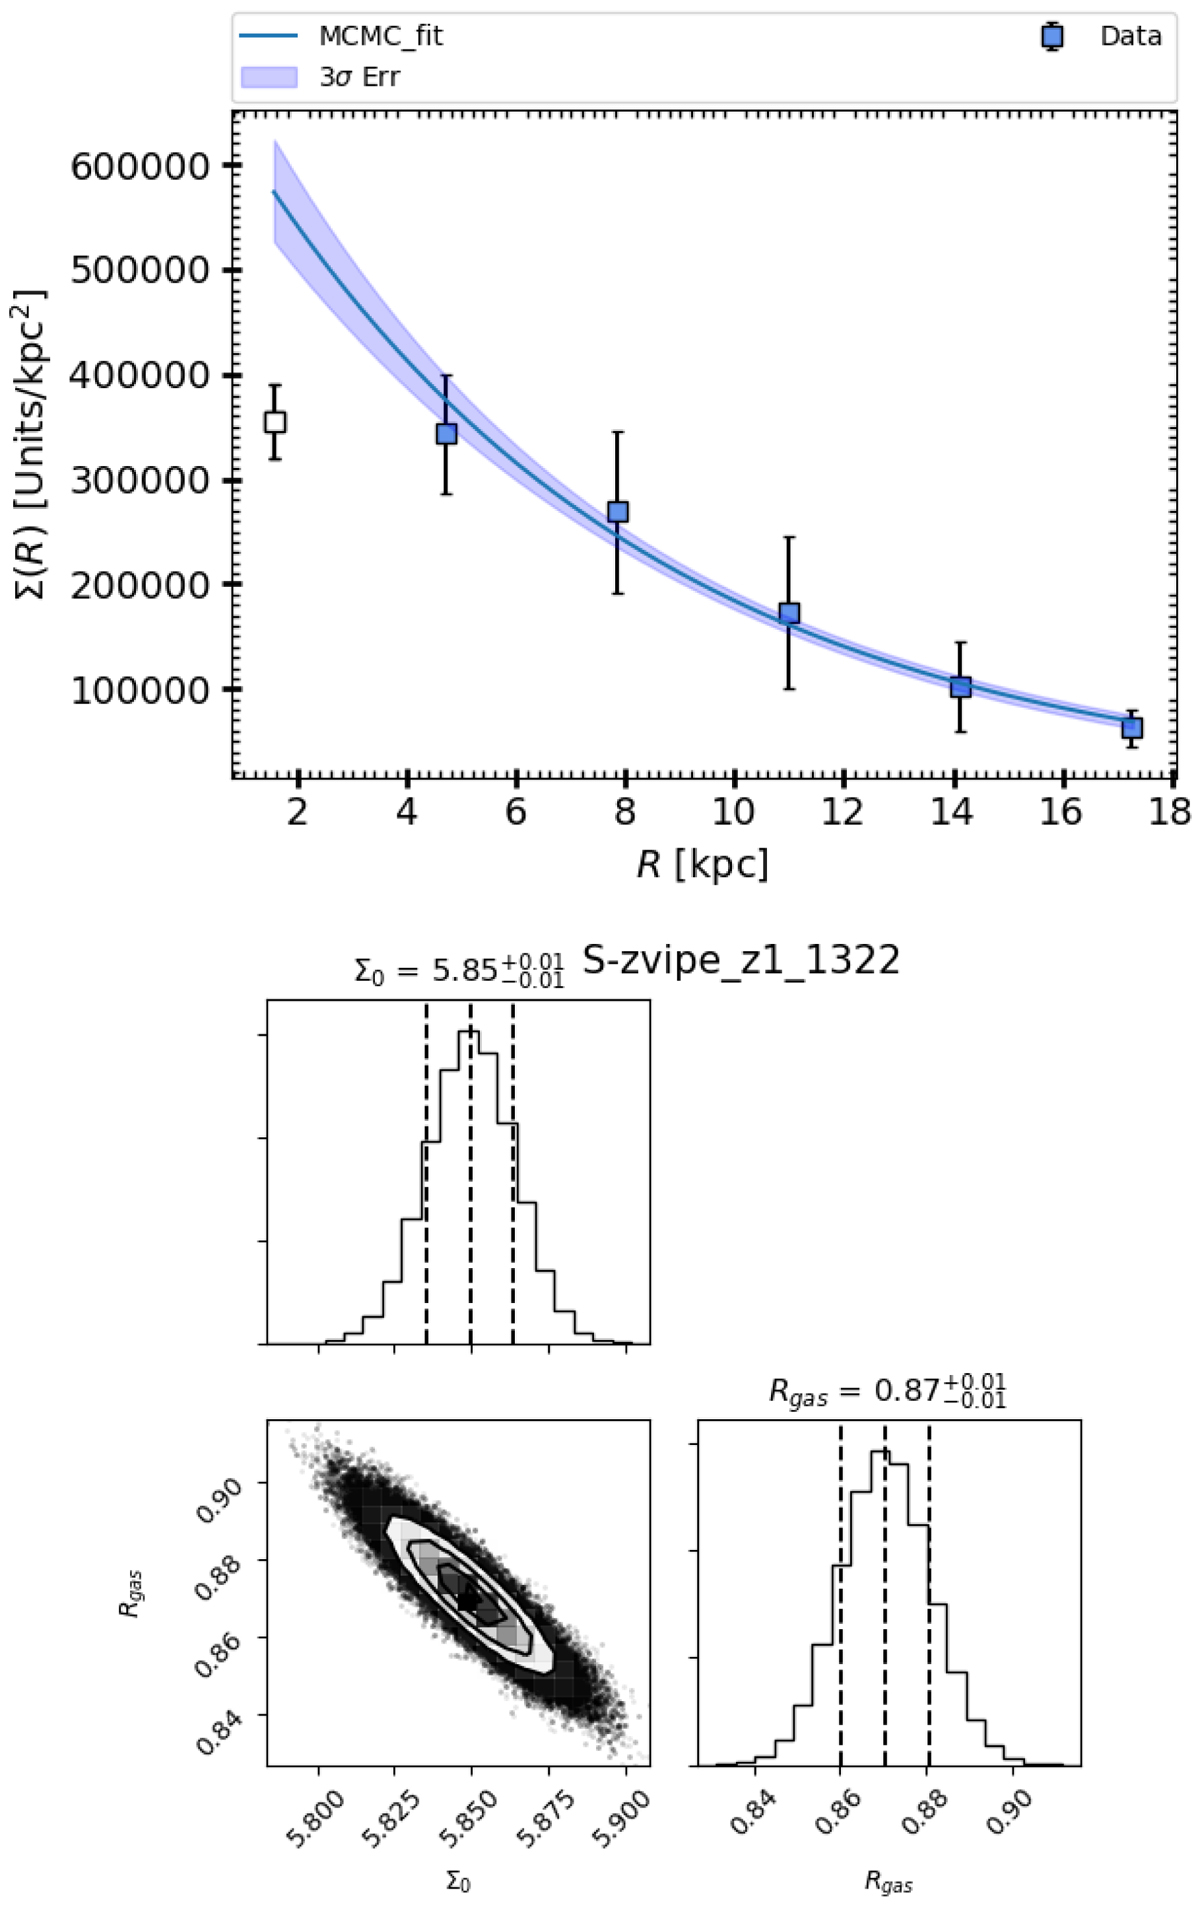
Fig. C.1.
Download original image
Upper panel: observed surface brightness of Hα gas. The MCMC fit is shown in blue accompanied by 1σ error (blue shaded area). The first point (open square) is not used in fitting owing to the limitation assigned by Barolo (discussed in Sharma et al. 2021). The value Σ0 keeps the dimension units/kpc2, where units =ergs1cm−2μ−11 1e + 17 km s−1. Lower panel: posterior distribution of Σ0 and Rgas, where vertical dashed lines show the 16, 50, 84 percentiles from left to right, respectively.
Current usage metrics show cumulative count of Article Views (full-text article views including HTML views, PDF and ePub downloads, according to the available data) and Abstracts Views on Vision4Press platform.
Data correspond to usage on the plateform after 2015. The current usage metrics is available 48-96 hours after online publication and is updated daily on week days.
Initial download of the metrics may take a while.