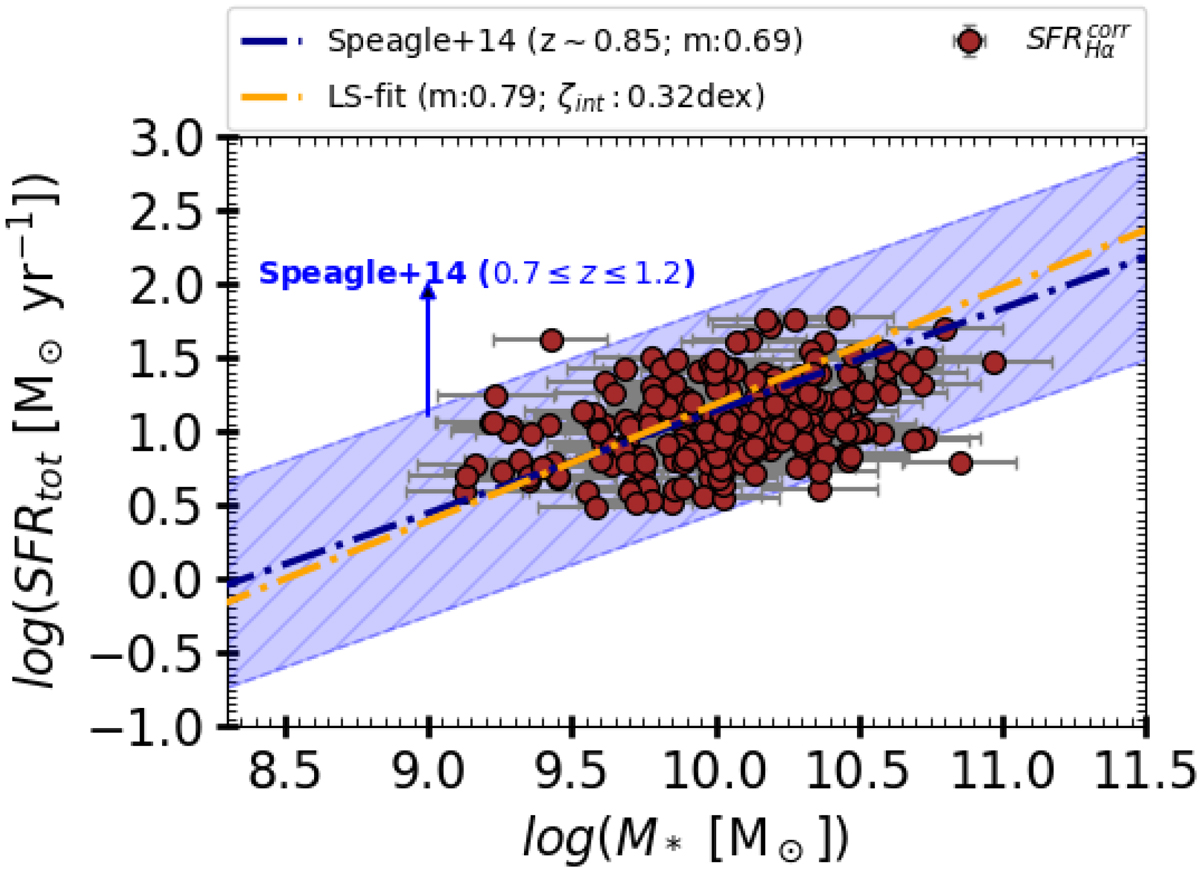
Fig. B.1.
Download original image
Star formation rate (SFR) vs. total stellar mass (M*), tracing the MS of galaxies, where SFRtot = SFRHα corrected for dust reddening. The brown filled circles represent the data used in this work. The dashed-dotted orange line shows the least-squares fit to our data, and the blue line shows the Speagle et al. (2014) MS relation at z ∼ 0.85. The shaded blue region represents the MS limit between redshift 0.7 ≤ z ≤ 1.2, which includes 0.3 dex uncertainty at each redshift.
Current usage metrics show cumulative count of Article Views (full-text article views including HTML views, PDF and ePub downloads, according to the available data) and Abstracts Views on Vision4Press platform.
Data correspond to usage on the plateform after 2015. The current usage metrics is available 48-96 hours after online publication and is updated daily on week days.
Initial download of the metrics may take a while.