Fig. 5.
Download original image
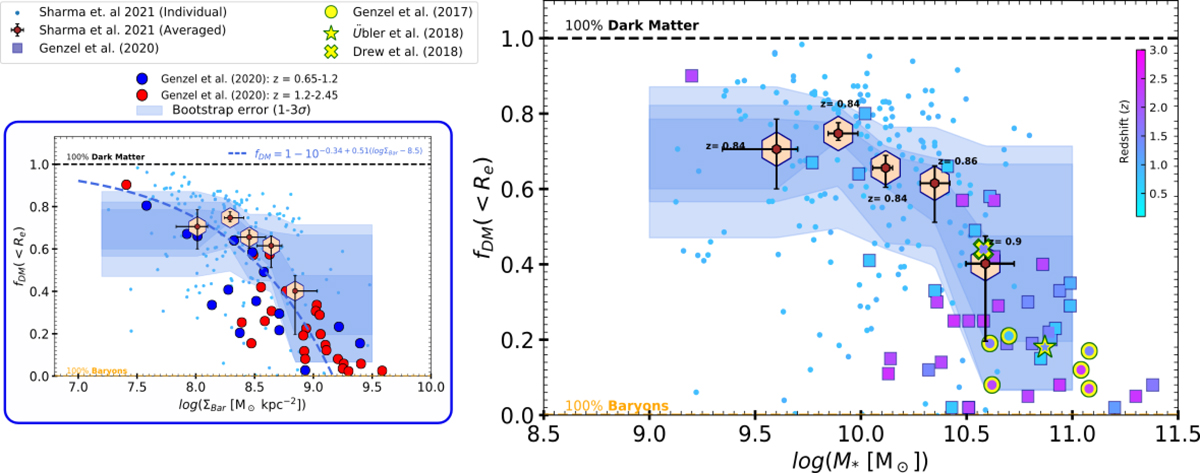
Comparison of averaged DM fraction (within Re) of our sample with previous high-z studies. Left panel: dark matter fraction as a function of baryon surface density ![]() . The brown hexagons with error bars shielded by big light-peach hexagons represent our averaged dataset, and individual galaxies are shown by small dots, color coded by redshift. The blue shaded area represents the 1−3σ error on the DM fraction. The dashed blue line shows the relation fDM(<Re) = 1−10−0.34 + 0.51(log ΣBar − 8.5) given by Genzel et al. (2020) and their data are plotted in blue (z= 0.65−1.2) and red (z= 1.2−2.45) filled circles. Right panel: dark matter fraction as a function of stellar mass, color coded by redshift. Our dataset and its errors are presented in similar manner in both panels. Genzel et al. (2020) data are shown by filled squares. The measurements of Genzel et al. (2017), Drew et al. (2018), and Übler et al. (2018) are shown by yellow circles, a star and crosses, respectively, where the interior of each marker is color coded by redshift. The legend of the right plot is shown in the upper of left plot.
. The brown hexagons with error bars shielded by big light-peach hexagons represent our averaged dataset, and individual galaxies are shown by small dots, color coded by redshift. The blue shaded area represents the 1−3σ error on the DM fraction. The dashed blue line shows the relation fDM(<Re) = 1−10−0.34 + 0.51(log ΣBar − 8.5) given by Genzel et al. (2020) and their data are plotted in blue (z= 0.65−1.2) and red (z= 1.2−2.45) filled circles. Right panel: dark matter fraction as a function of stellar mass, color coded by redshift. Our dataset and its errors are presented in similar manner in both panels. Genzel et al. (2020) data are shown by filled squares. The measurements of Genzel et al. (2017), Drew et al. (2018), and Übler et al. (2018) are shown by yellow circles, a star and crosses, respectively, where the interior of each marker is color coded by redshift. The legend of the right plot is shown in the upper of left plot.
Current usage metrics show cumulative count of Article Views (full-text article views including HTML views, PDF and ePub downloads, according to the available data) and Abstracts Views on Vision4Press platform.
Data correspond to usage on the plateform after 2015. The current usage metrics is available 48-96 hours after online publication and is updated daily on week days.
Initial download of the metrics may take a while.