Fig. 3.
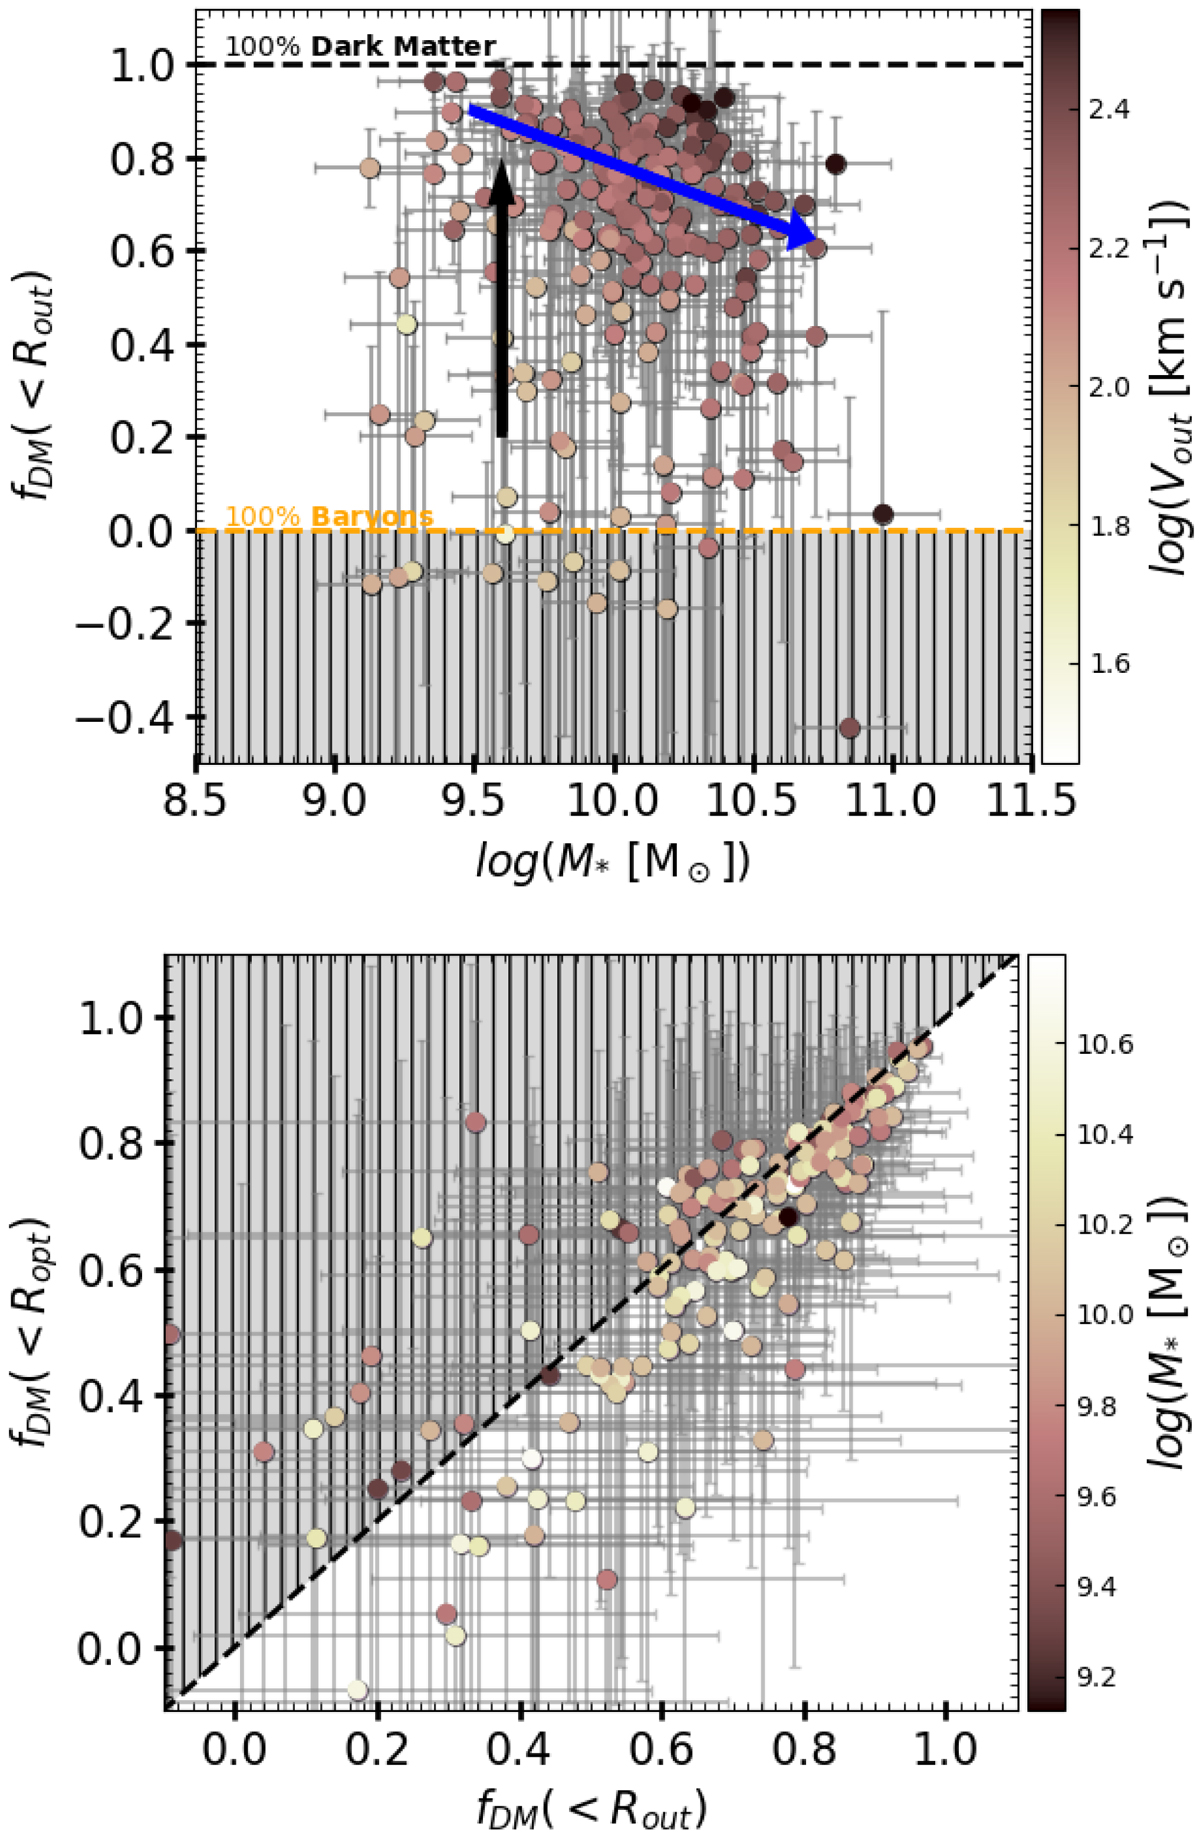
Download original image
DM fraction of individual galaxies. Upper panel: dark matter fraction within Rout as a function of stellar mass (M*), color coded by the circular velocity (Vout) computed at Rout. The horizontal yellow and back dashed lines show the 100% baryon and DM regimes, respectively. The gray shaded area shows the forbidden region. The black arrow indicates that, for a given stellar mass, the fraction of DM in the galaxies increases with increasing circular velocity. The blue arrow shows a shallow decrease in the DM fraction with increasing stellar mass. Lower panel:fDM(<Ropt) vs. fDM(<Rout), color coded by stellar mass. The gray shaded area represents the not allowed region (i.e., fDM(<Rout) ≮ fDM(<Ropt)). The black dashed line shows the one-to-one relation. For the clarity of the figure (in the lower panel), objects below zero are not shown.
Current usage metrics show cumulative count of Article Views (full-text article views including HTML views, PDF and ePub downloads, according to the available data) and Abstracts Views on Vision4Press platform.
Data correspond to usage on the plateform after 2015. The current usage metrics is available 48-96 hours after online publication and is updated daily on week days.
Initial download of the metrics may take a while.