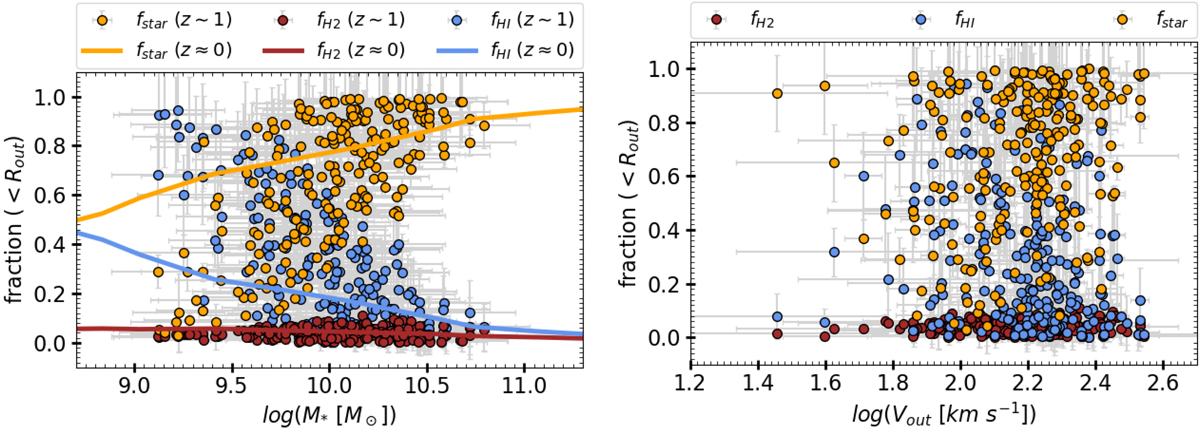
Fig. 1.
Download original image
Stellar and gas mass fraction of our sample as a function of stellar mass and circular velocity (left and right panel, respectively) within the outer radius (Rout; i.e., visible region). The color code in both panels is the same and given as follows: the brown filled circles represent the molecular gas mass fraction (fH2 = MH2(<Rout)/Mbar(<Rout)), the orange filled circles indicate the star mass fraction (fstar = M*(<Rout)/Mbar(<Rout)), and the blue filled circles represent the atomic gas mass fraction (fHI = MHI(< Rout)/Mbar(< Rout)). A comparison study of local late-type galaxies from Calette et al. (2018) is drawn by solid lines; the color coding is same as the high-z objects.
Current usage metrics show cumulative count of Article Views (full-text article views including HTML views, PDF and ePub downloads, according to the available data) and Abstracts Views on Vision4Press platform.
Data correspond to usage on the plateform after 2015. The current usage metrics is available 48-96 hours after online publication and is updated daily on week days.
Initial download of the metrics may take a while.