Fig. 7.
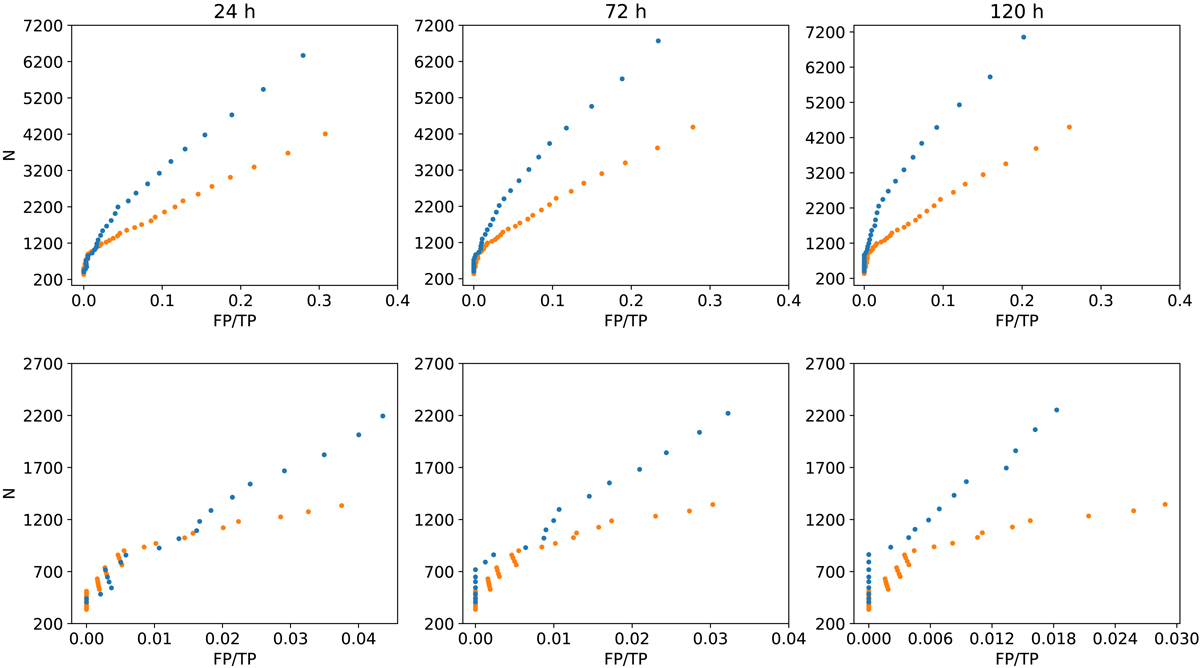
Number of true detections from both methods as a function of the ratio of false positives (FP) to total positives (TP). The second row shows a close-up look at the results from thresholds higher than S = 400 (standard seismic method) and Pi = 100 (FarNet). Each column represents the results of the comparison with 24 h (first column), 72 h (second column), and 120 h (third column) of STEREO data.
Current usage metrics show cumulative count of Article Views (full-text article views including HTML views, PDF and ePub downloads, according to the available data) and Abstracts Views on Vision4Press platform.
Data correspond to usage on the plateform after 2015. The current usage metrics is available 48-96 hours after online publication and is updated daily on week days.
Initial download of the metrics may take a while.