Fig. 5.
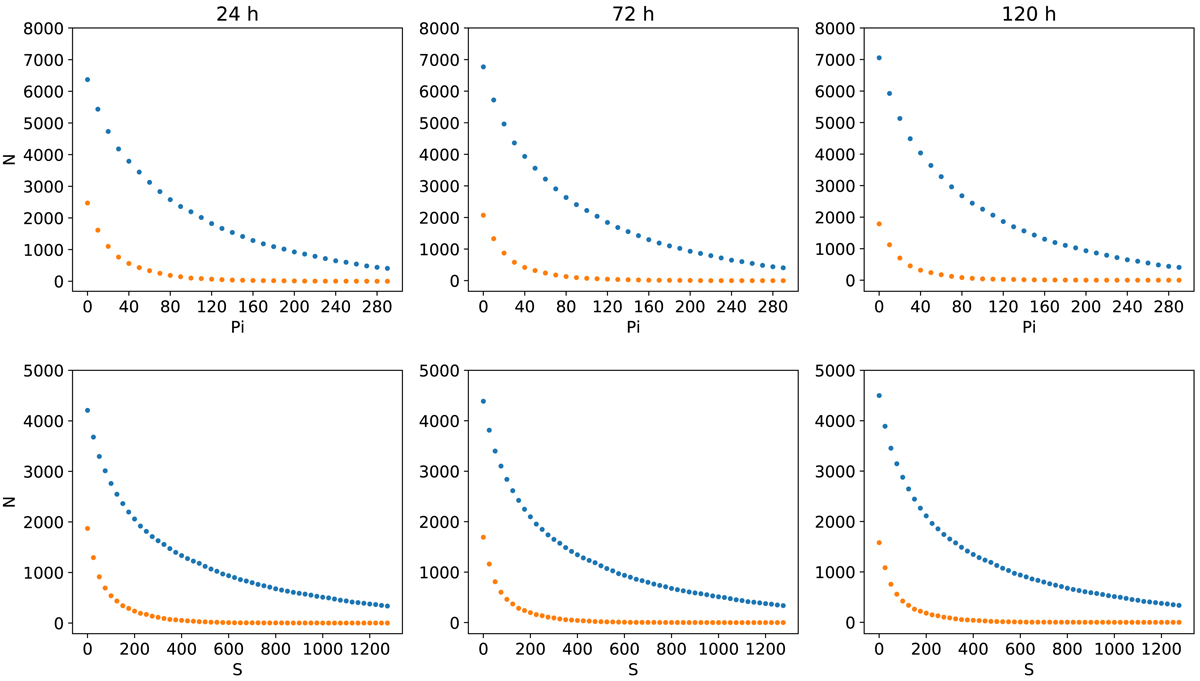
True detections (blue dots) and false positives (orange dots) from FarNet (first row) and from the standard seismic method (second row) over the whole range of dates of the study. Each dot corresponds to the detections with Pi or S over the X axis value. Each column represents the results of the comparison with 24 h (first column), 72 h (second column), and 120 h (third column) of STEREO data.
Current usage metrics show cumulative count of Article Views (full-text article views including HTML views, PDF and ePub downloads, according to the available data) and Abstracts Views on Vision4Press platform.
Data correspond to usage on the plateform after 2015. The current usage metrics is available 48-96 hours after online publication and is updated daily on week days.
Initial download of the metrics may take a while.