Fig. 3.
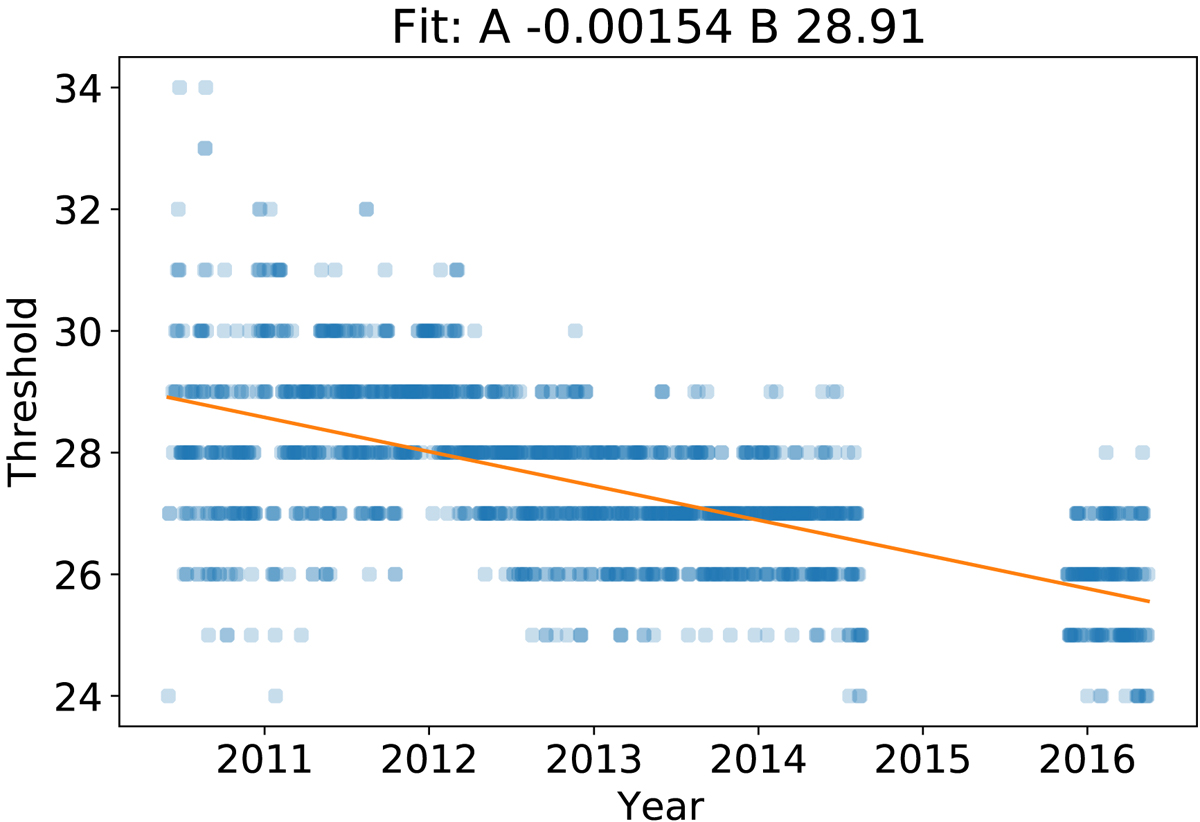
Ideal threshold of the EUV images derived from the comparison of near-side EUV and activity masks as a function of time. Blue dots represent the ideal threshold determined for individual cases. Darker blue regions illustrate a higher concentration of cases. The orange line shows the linear fit of the thresholds, which gives the actual threshold applied to far-side EUV data to compute the EUV masks. Fit coefficients can be found at the top of the figure. Dates range from June 2010 to May 2016, with a gap in STEREO/SDO composite images from August 2014 to November 2015.
Current usage metrics show cumulative count of Article Views (full-text article views including HTML views, PDF and ePub downloads, according to the available data) and Abstracts Views on Vision4Press platform.
Data correspond to usage on the plateform after 2015. The current usage metrics is available 48-96 hours after online publication and is updated daily on week days.
Initial download of the metrics may take a while.