Fig. 7.
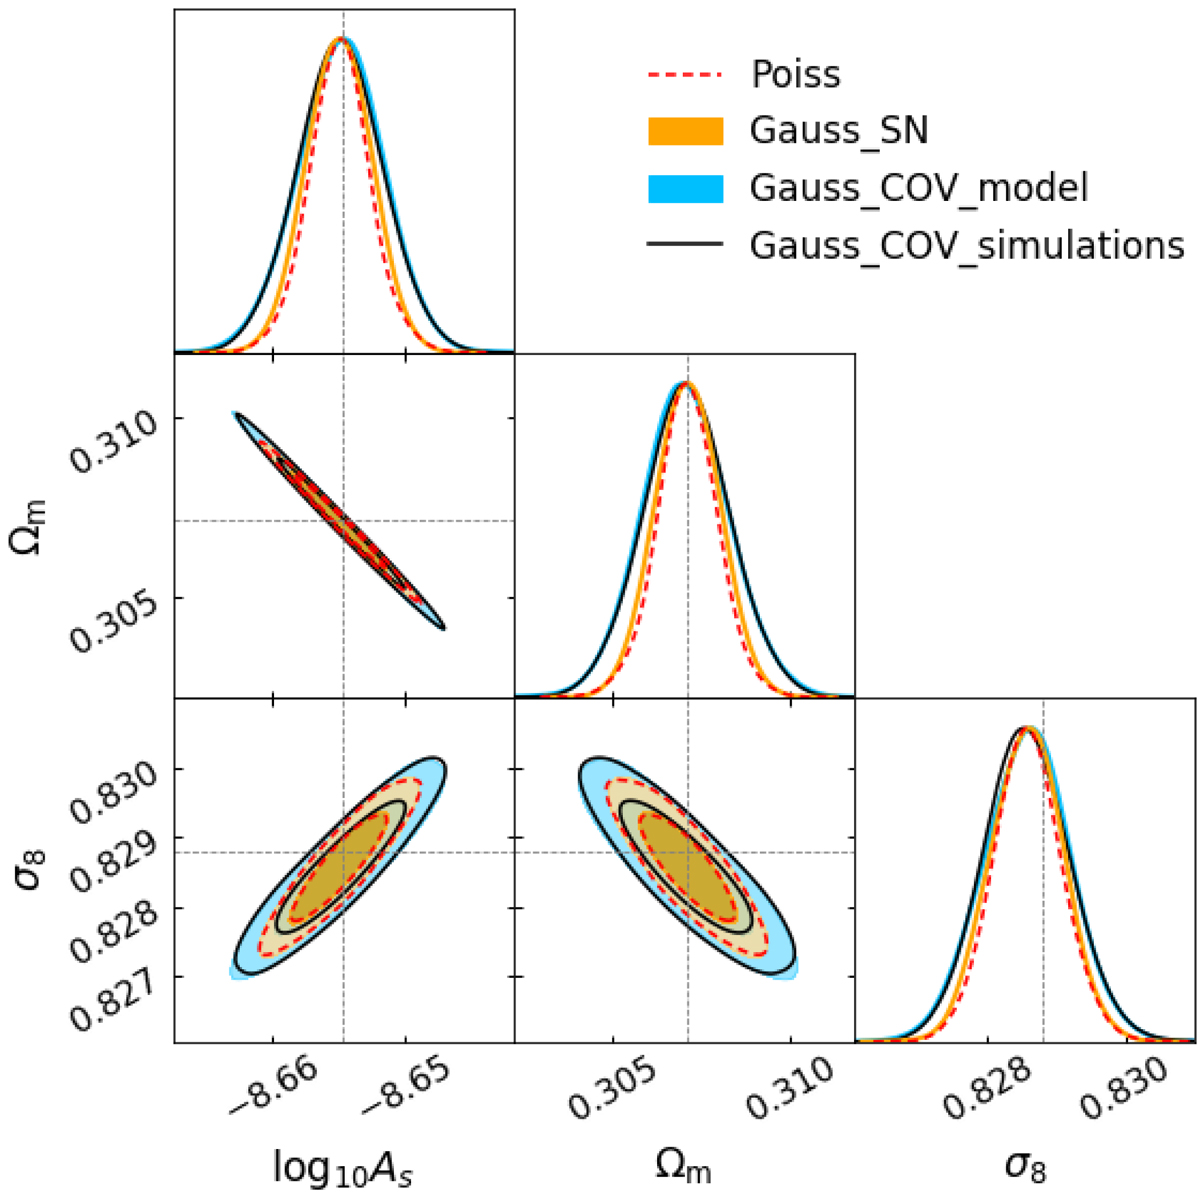
Contour plots at 68 and 95 per cent of confidence level for the three likelihood functions: Poissonian (red), Gaussian with only shot-noise (orange) and Gaussian with shot-noise and sample variance, with covariance from the analytical model (blue) and from simulations (black). The gray dotted lines represent the input values of parameters.
Current usage metrics show cumulative count of Article Views (full-text article views including HTML views, PDF and ePub downloads, according to the available data) and Abstracts Views on Vision4Press platform.
Data correspond to usage on the plateform after 2015. The current usage metrics is available 48-96 hours after online publication and is updated daily on week days.
Initial download of the metrics may take a while.