Fig. 4.
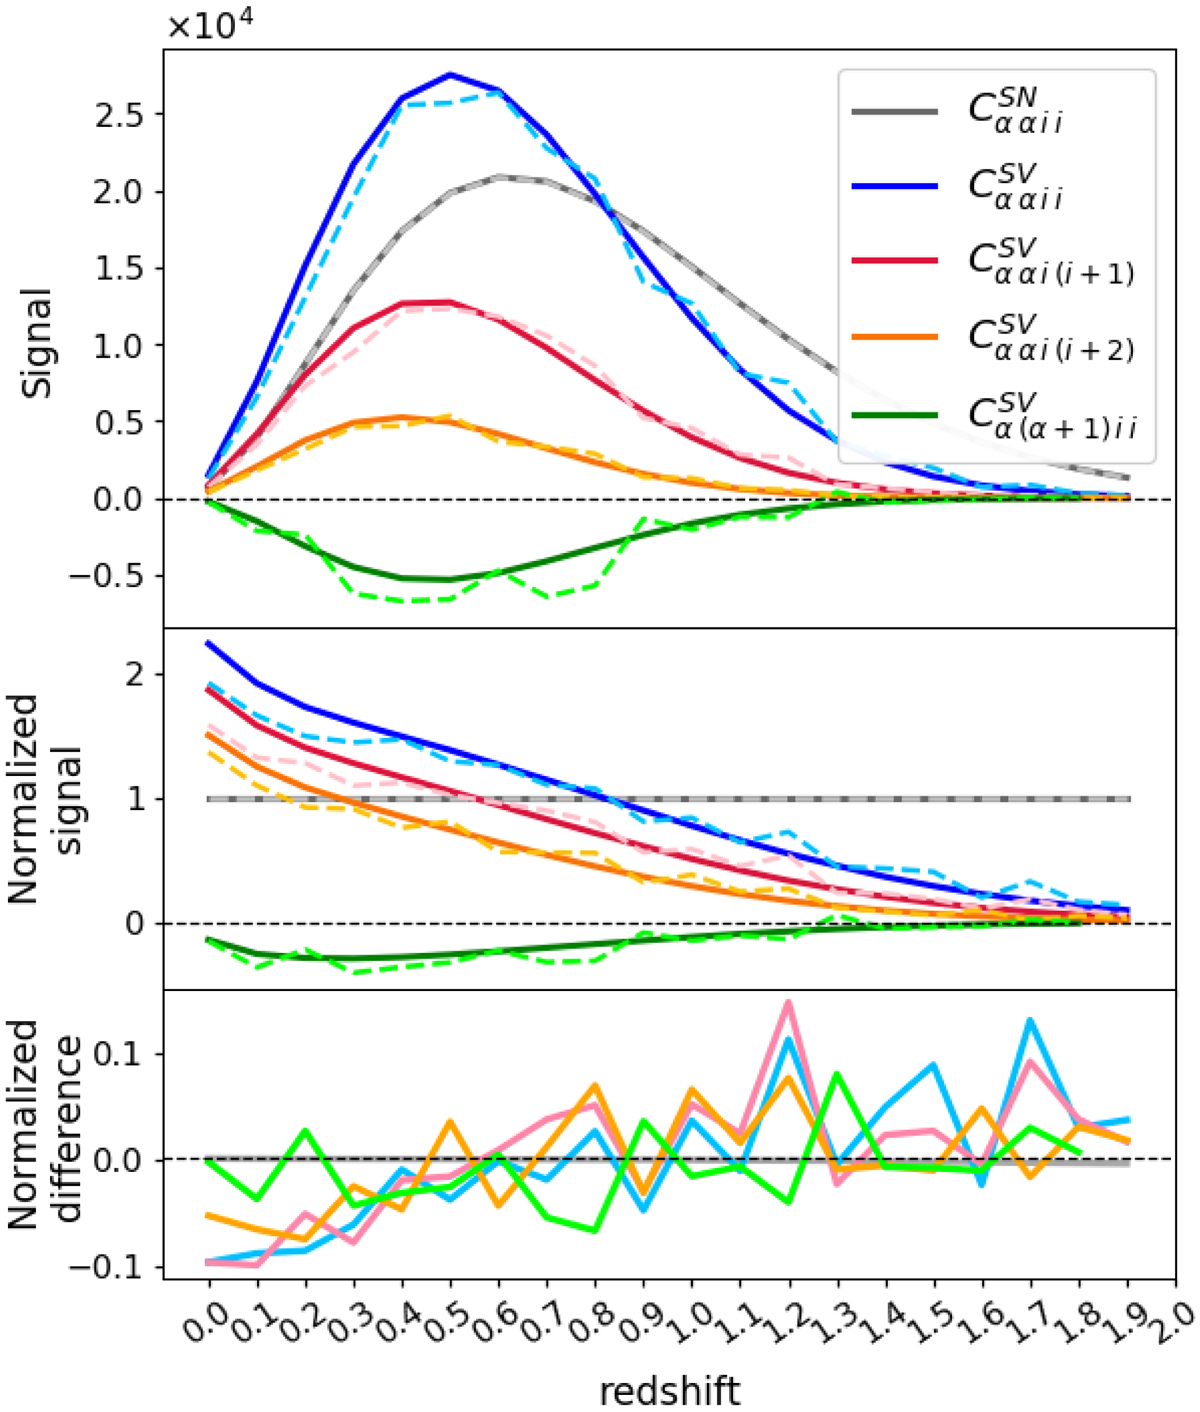
Covariance (upper panel) and covariance normalized to the shot-noise level (central panel) as predicted by the Hu & Kravtsov (2003) analytical model (solid lines) and by simulations (dashed lines) for different matrix components: diagonal sample variance terms in blue, diagonal sample variance terms in two different mass bins in red and orange, sample variance between two adjacent redshift bins in green and shot-noise in gray. Lower panel: relative difference between analytical model and simulations. The curves are represented as a function of redshift, in the first mass bin (i = 1).
Current usage metrics show cumulative count of Article Views (full-text article views including HTML views, PDF and ePub downloads, according to the available data) and Abstracts Views on Vision4Press platform.
Data correspond to usage on the plateform after 2015. The current usage metrics is available 48-96 hours after online publication and is updated daily on week days.
Initial download of the metrics may take a while.