Open Access
Fig. 2.
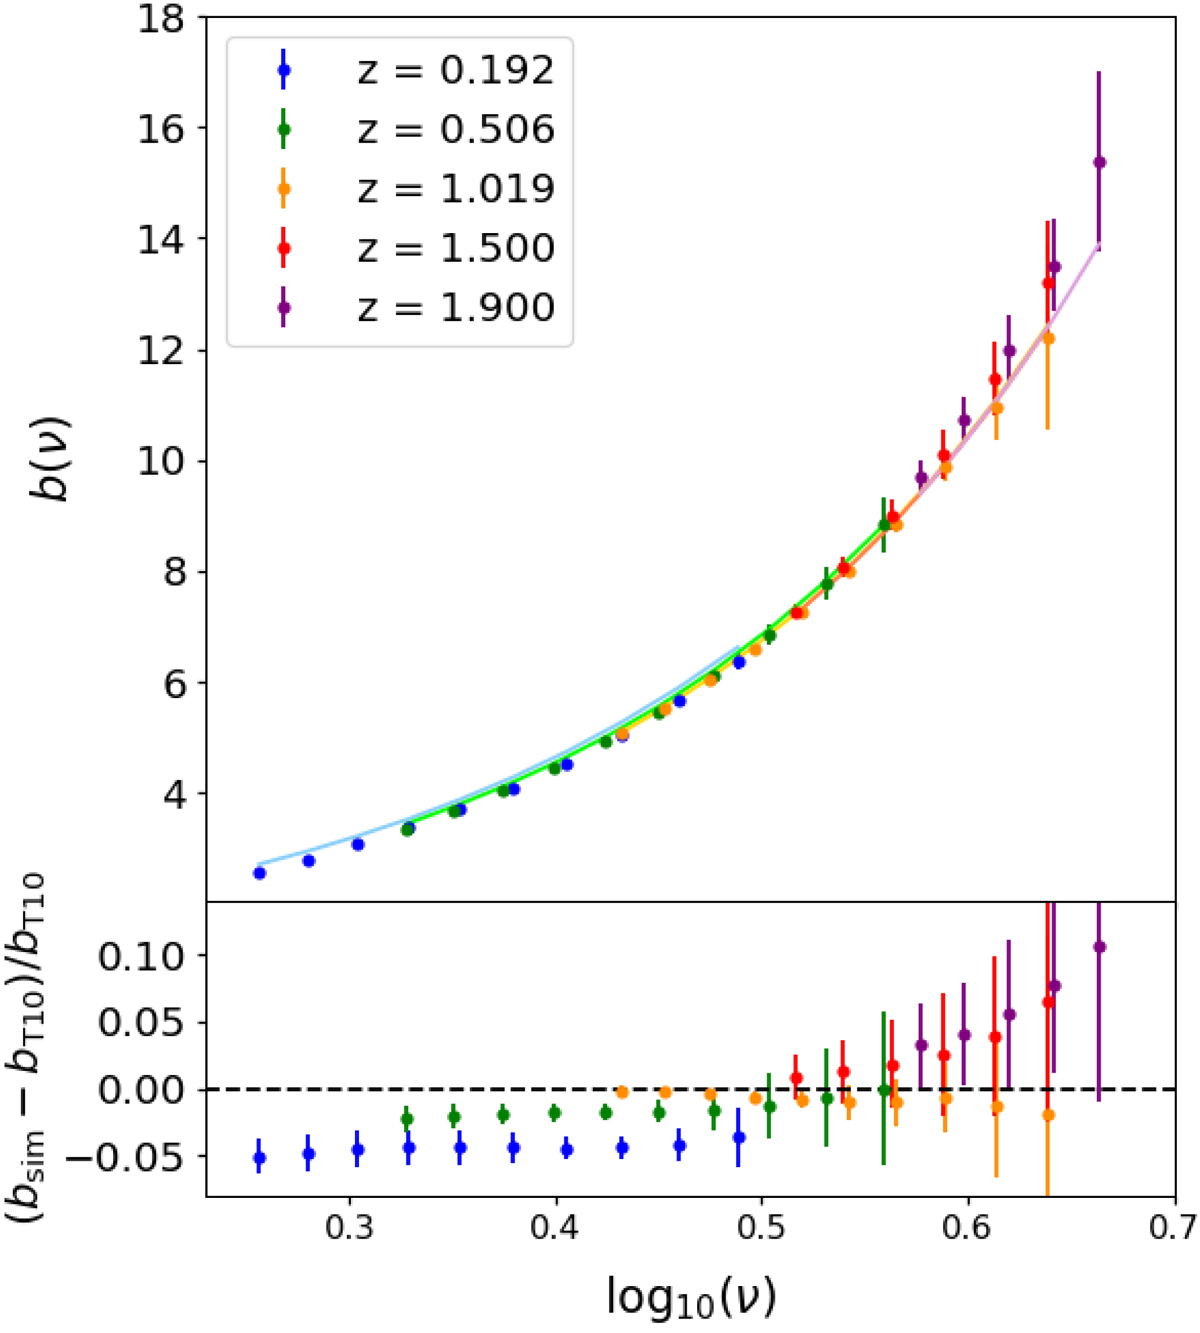
Comparison between the T10 halo bias and the bias from the simulations. Top panel: halo bias from simulations at different redshifts (colored dots), compared to the analytical model of T10 (lighter solid lines). Bottom panel: fractional differences between the bias from simulations and from the model.
Current usage metrics show cumulative count of Article Views (full-text article views including HTML views, PDF and ePub downloads, according to the available data) and Abstracts Views on Vision4Press platform.
Data correspond to usage on the plateform after 2015. The current usage metrics is available 48-96 hours after online publication and is updated daily on week days.
Initial download of the metrics may take a while.