Open Access
Fig. B.1.
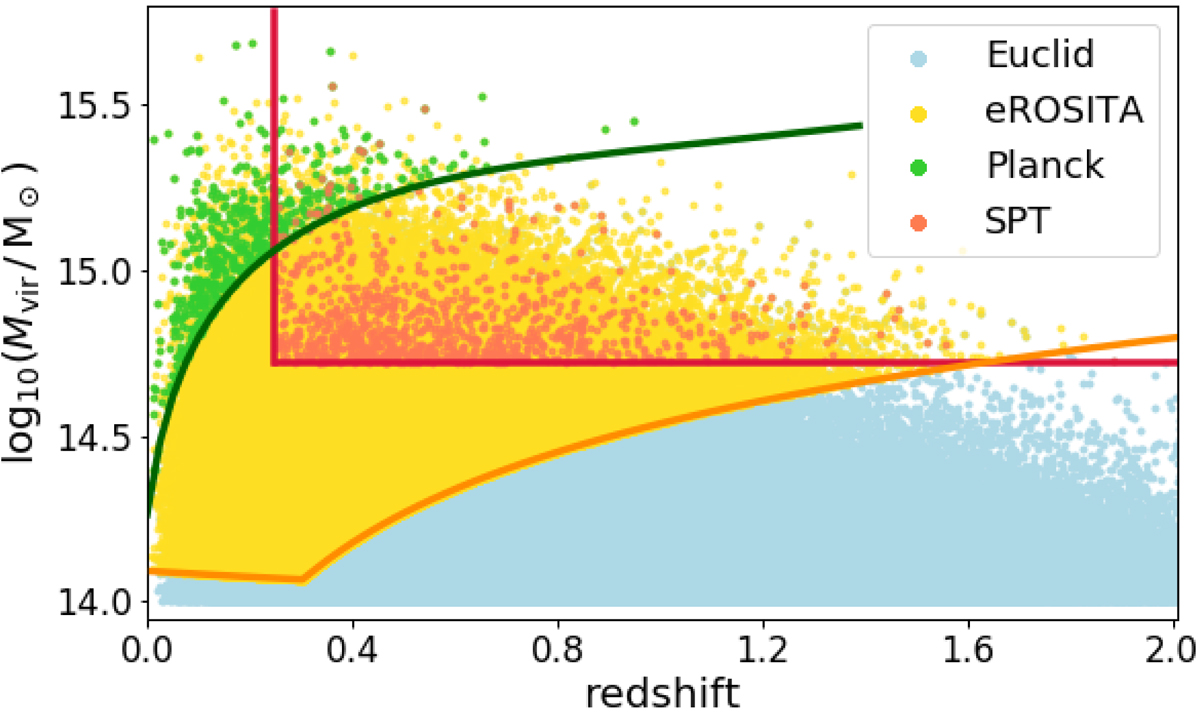
Mass distribution of the three samples extracted from a single light-cone, with the respective selection functions: Planck in green, SPT in red and eROSITA in orange, overplotted to the full Euclid sample in blue.
Current usage metrics show cumulative count of Article Views (full-text article views including HTML views, PDF and ePub downloads, according to the available data) and Abstracts Views on Vision4Press platform.
Data correspond to usage on the plateform after 2015. The current usage metrics is available 48-96 hours after online publication and is updated daily on week days.
Initial download of the metrics may take a while.