Fig. A.1.
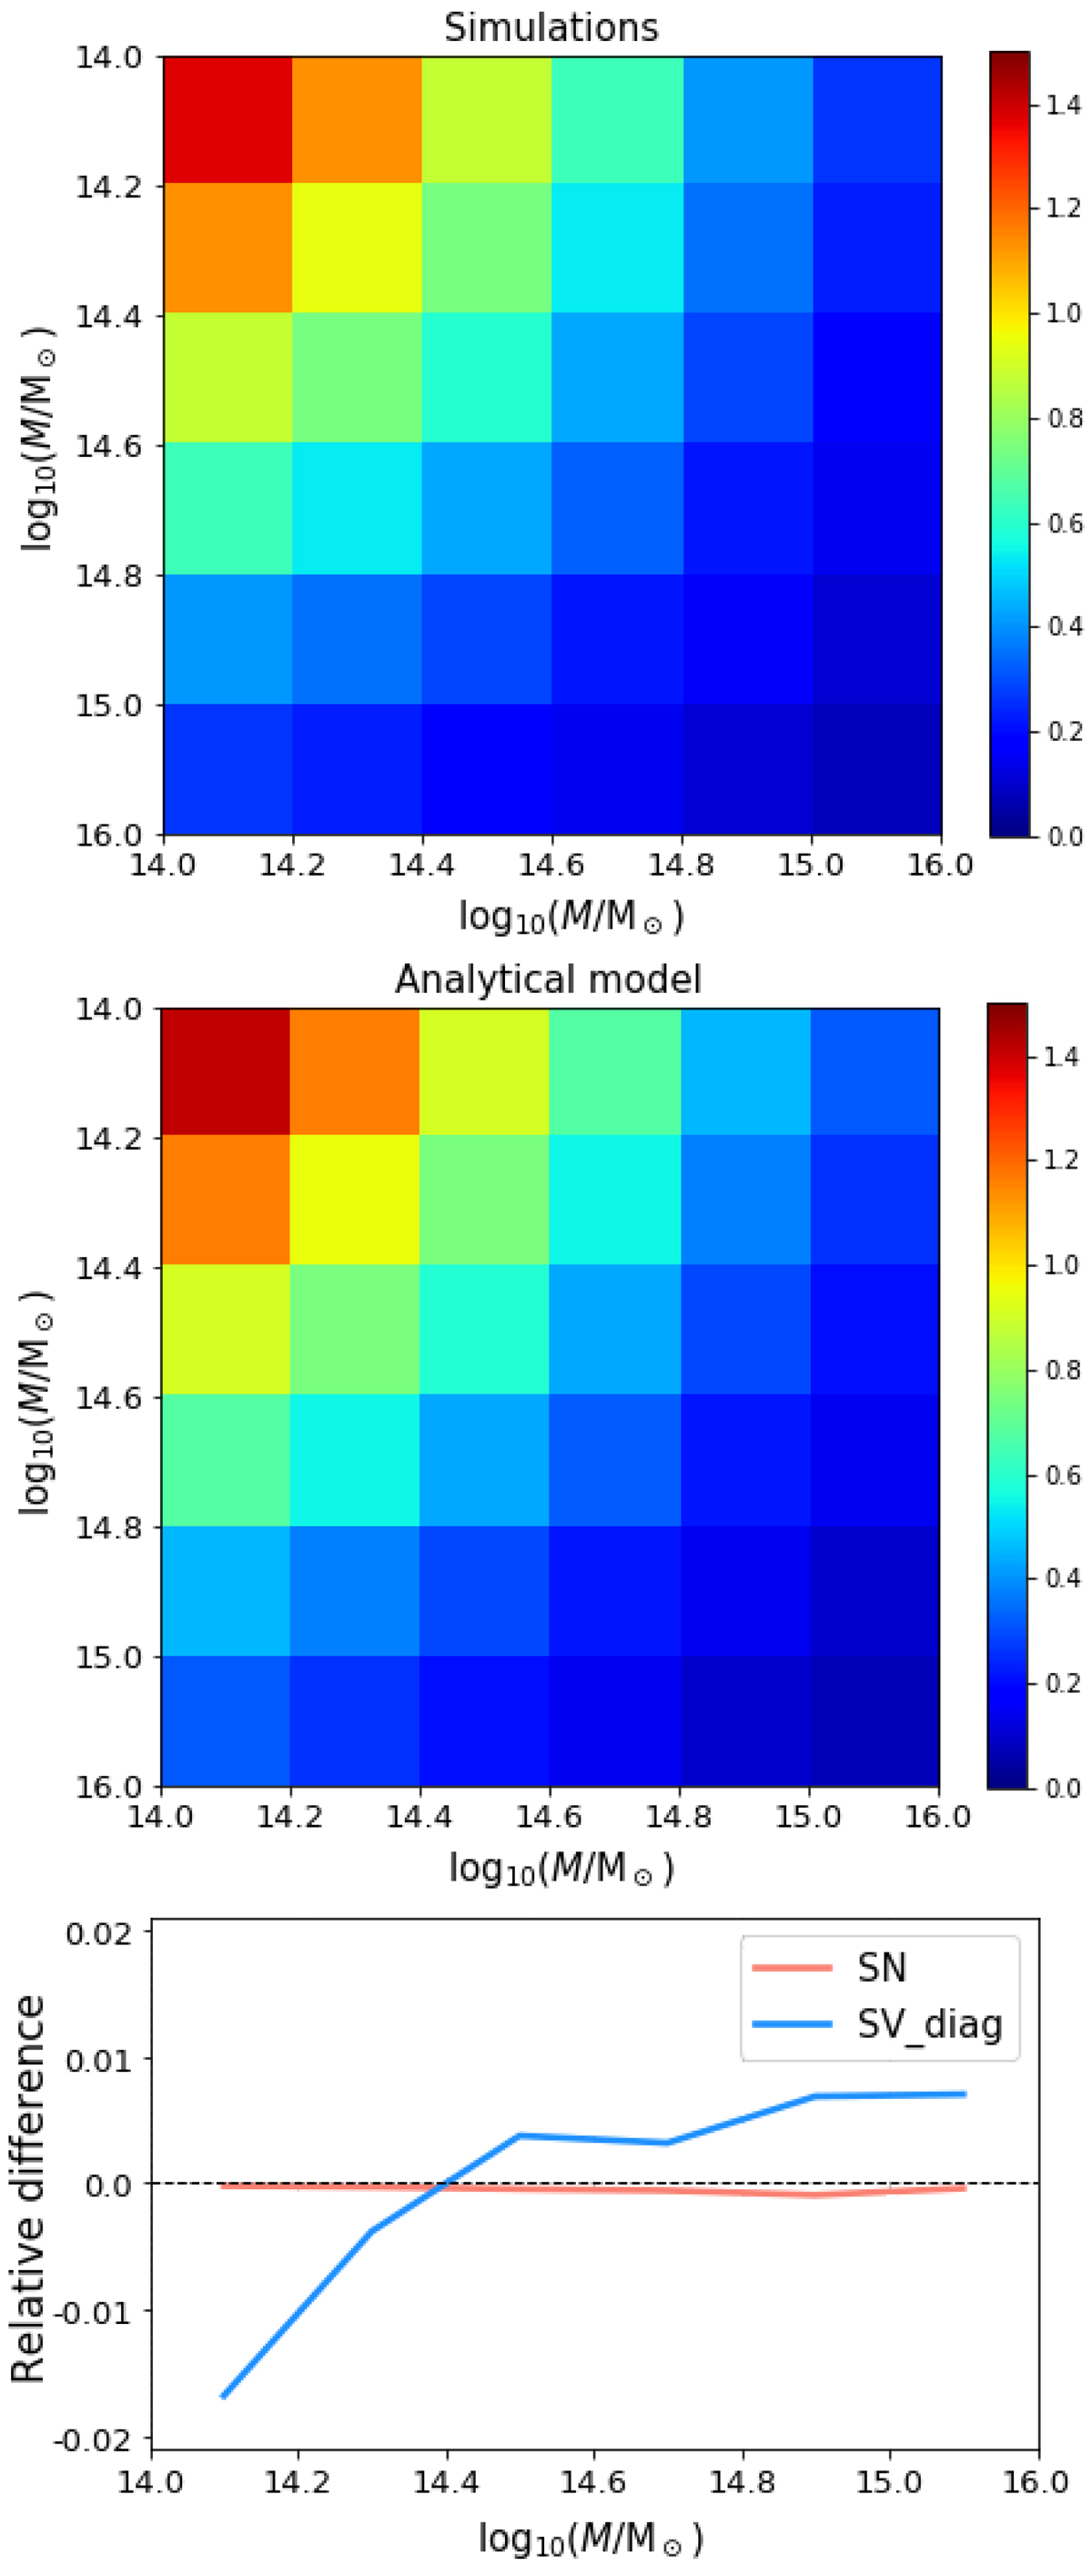
Normalized sample covariance between mass bins from simulations (top) and our analytical model (center), computed for 106 spherical sub-boxes of radius R = 200 h−1 Mpc at redshift z = 0.506 and in the mass range of 1014 ≤ M/M⊙ ≤ 1016. Bottom panel: relative difference between simulations and model for the diagonal elements of the sample covariance matrix (blue) and for the shot-noise (red).
Current usage metrics show cumulative count of Article Views (full-text article views including HTML views, PDF and ePub downloads, according to the available data) and Abstracts Views on Vision4Press platform.
Data correspond to usage on the plateform after 2015. The current usage metrics is available 48-96 hours after online publication and is updated daily on week days.
Initial download of the metrics may take a while.