Fig. 10.
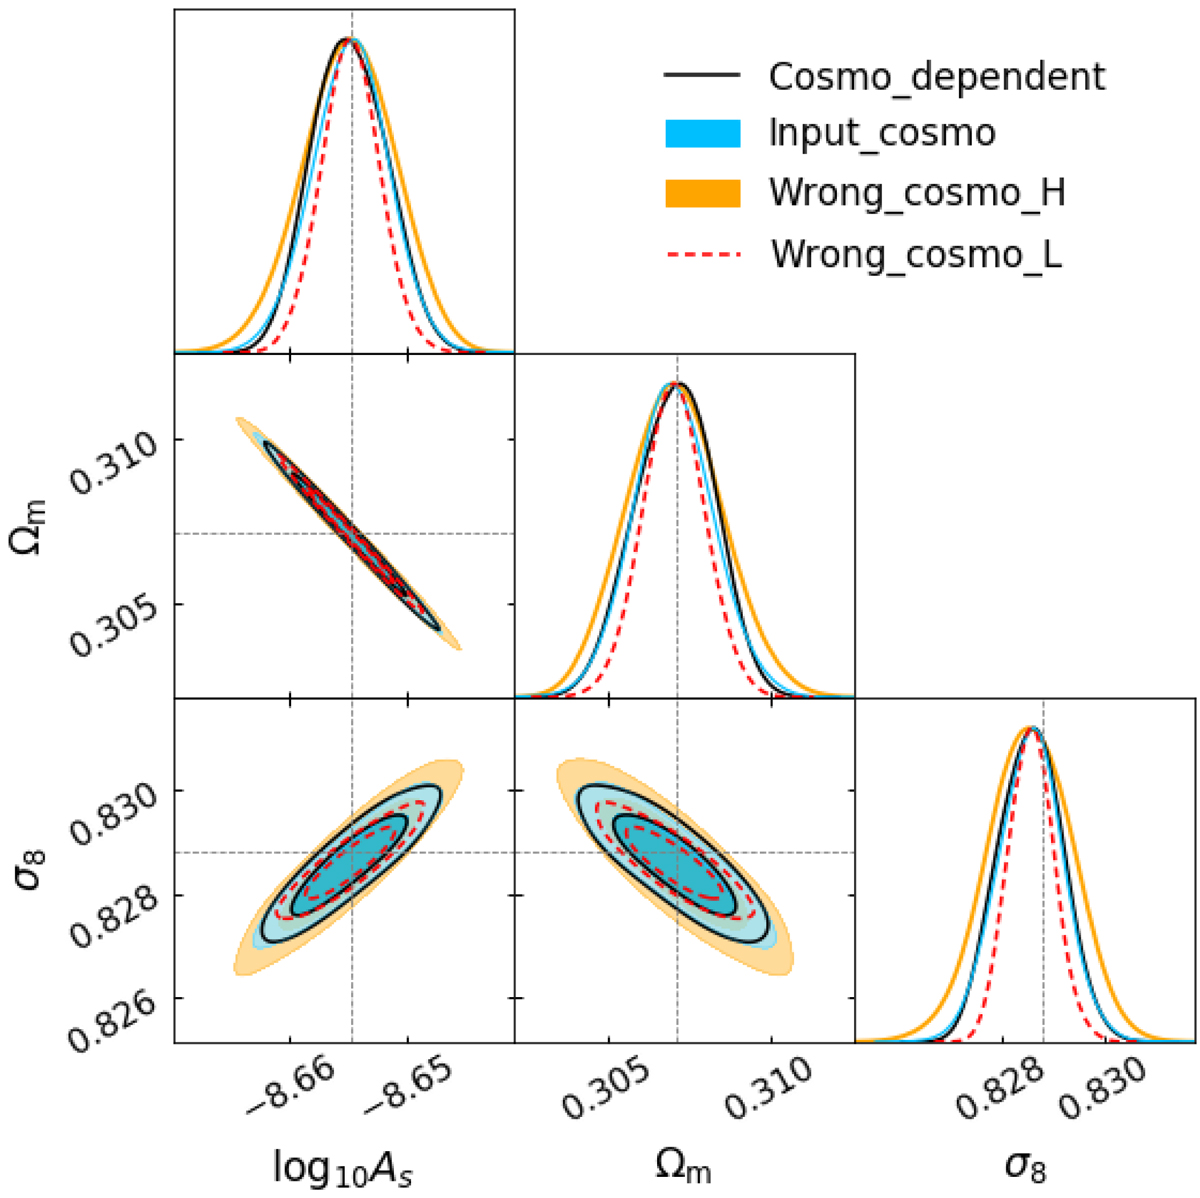
Contour plots at the 68 and 95 percent confidence levels for the Gaussian likelihood evaluated with: a cosmology-dependent covariance matrix (black), a covariance matrix fixed at the input cosmology (blue) and covariance matrices computed at two wrong cosmologies, one with lower parameter values (Ωm = 0.295, log10 As = −8.685 and σ8 = 0.776, red) and one with higher parameter values (Ωm = 0.320, log10 As = −8.625 and σ8 = 0.884, orange). The gray dotted lines represent the input values of parameters.
Current usage metrics show cumulative count of Article Views (full-text article views including HTML views, PDF and ePub downloads, according to the available data) and Abstracts Views on Vision4Press platform.
Data correspond to usage on the plateform after 2015. The current usage metrics is available 48-96 hours after online publication and is updated daily on week days.
Initial download of the metrics may take a while.