Fig. 6.
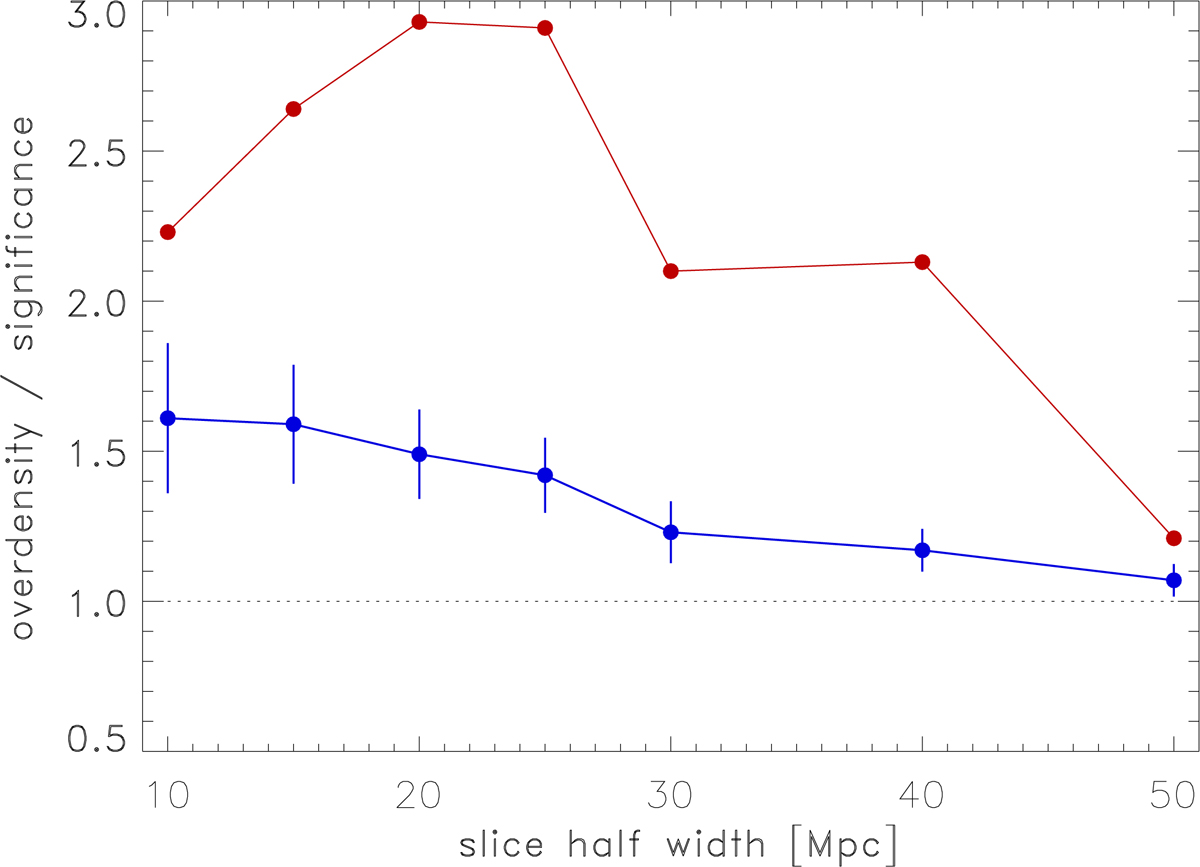
Overdensity of galaxy clusters in a slice of half width as specified on the X-axis with respect to the mean density in the survey within a sphere of 100 Mpc radius (lower curve with error bars). For the meaning of the error bars, readers can consult the text in Sects. 4.1 and 4.2. The upper curve indicates the significance of the existence of an overdensity in the underlying matter density distribution.
Current usage metrics show cumulative count of Article Views (full-text article views including HTML views, PDF and ePub downloads, according to the available data) and Abstracts Views on Vision4Press platform.
Data correspond to usage on the plateform after 2015. The current usage metrics is available 48-96 hours after online publication and is updated daily on week days.
Initial download of the metrics may take a while.