Fig. 4.
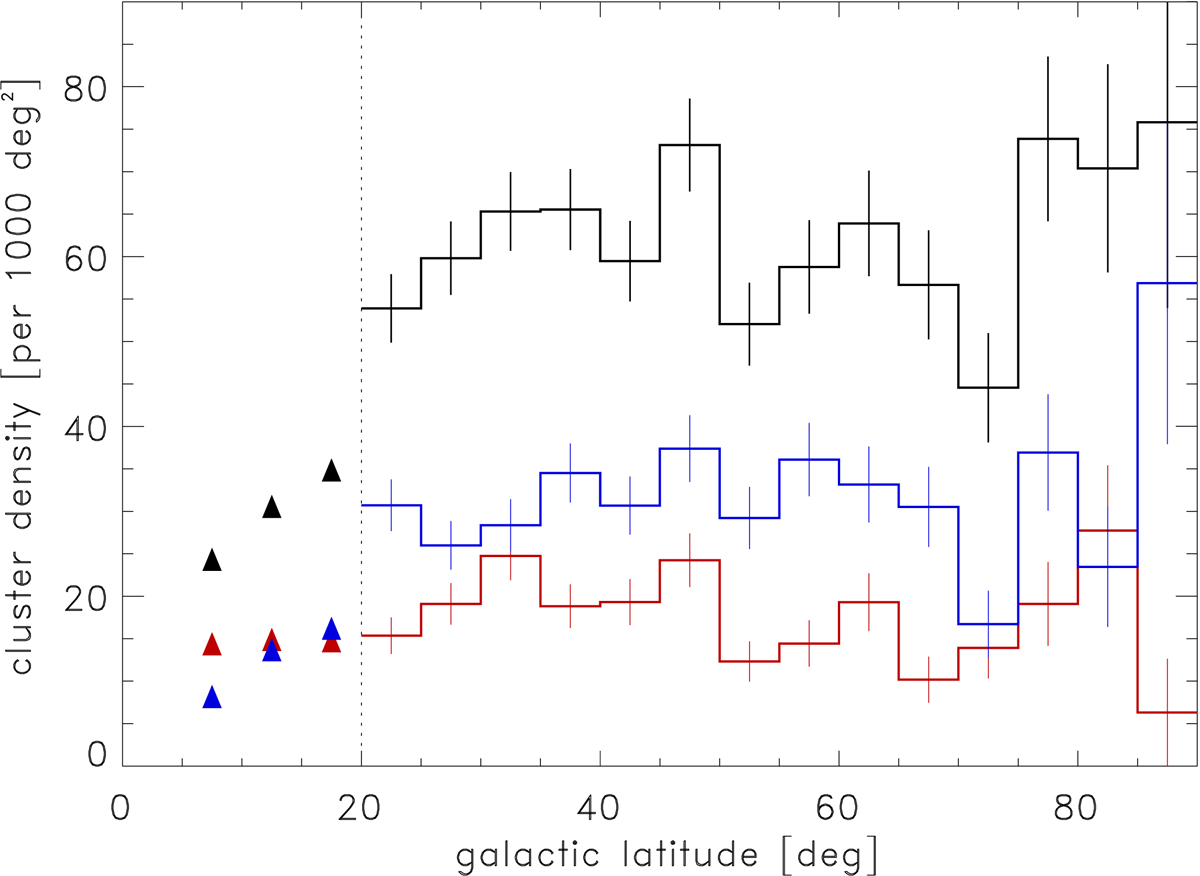
Surface density of the CLASSIX galaxy clusters on the sky as a function of galactic latitude, |bII|. The black histogram shows all clusters, while the red one shows clusters in the redshift range z = 0.−0.07 and the blue one clusters at z = 0.07−0.2. No clusters are detected closer than five degrees to the Galactic plane due to the restriction to the region with nH ≤ 2.5 × 1021 cm−2. The dotted line shows the boundary of the ZoA. Inside this boundary, we provide lower limits for the cluster density since the redshift survey is incomplete there.
Current usage metrics show cumulative count of Article Views (full-text article views including HTML views, PDF and ePub downloads, according to the available data) and Abstracts Views on Vision4Press platform.
Data correspond to usage on the plateform after 2015. The current usage metrics is available 48-96 hours after online publication and is updated daily on week days.
Initial download of the metrics may take a while.