Fig. 3.
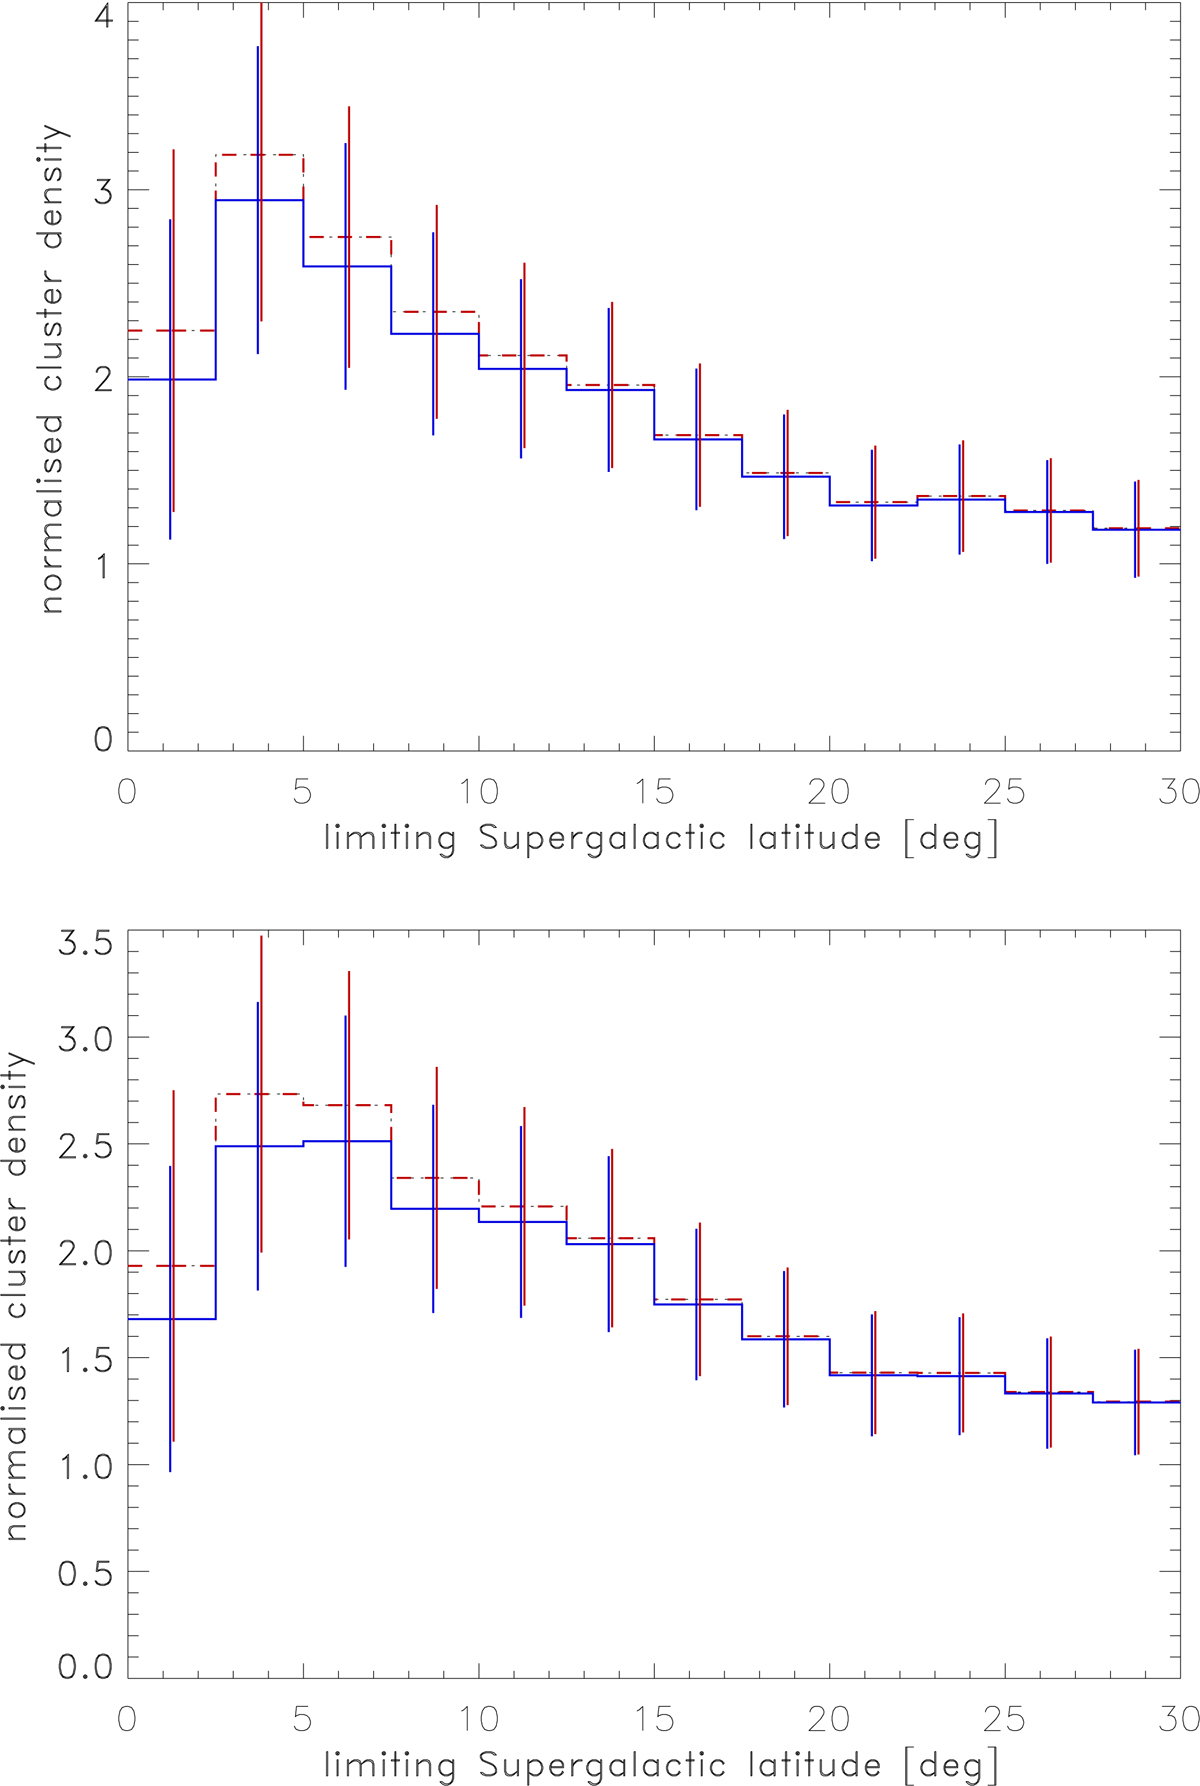
Sky surface density ratio of the CLASSIX clusters at z = 0−0.02 in a sky area limited by a maximum Supergalactic latitude, |bSG|, compared to the mean surface density in the full volume at z = 0−0.02. The solid blue curve shows the density determined with weights correcting for the sensitivity variations in the survey as explained in the text, while the dashed red line gives the unweighted density ratio. The meaning of the error bars is explained in Sect. 4.1. Top panel: results for the region outside the ZoA, bottom panel: results for the full sky region with hydrogen absorption column density nH ≤ 25 × 1020 cm−2.
Current usage metrics show cumulative count of Article Views (full-text article views including HTML views, PDF and ePub downloads, according to the available data) and Abstracts Views on Vision4Press platform.
Data correspond to usage on the plateform after 2015. The current usage metrics is available 48-96 hours after online publication and is updated daily on week days.
Initial download of the metrics may take a while.