Fig. 2.
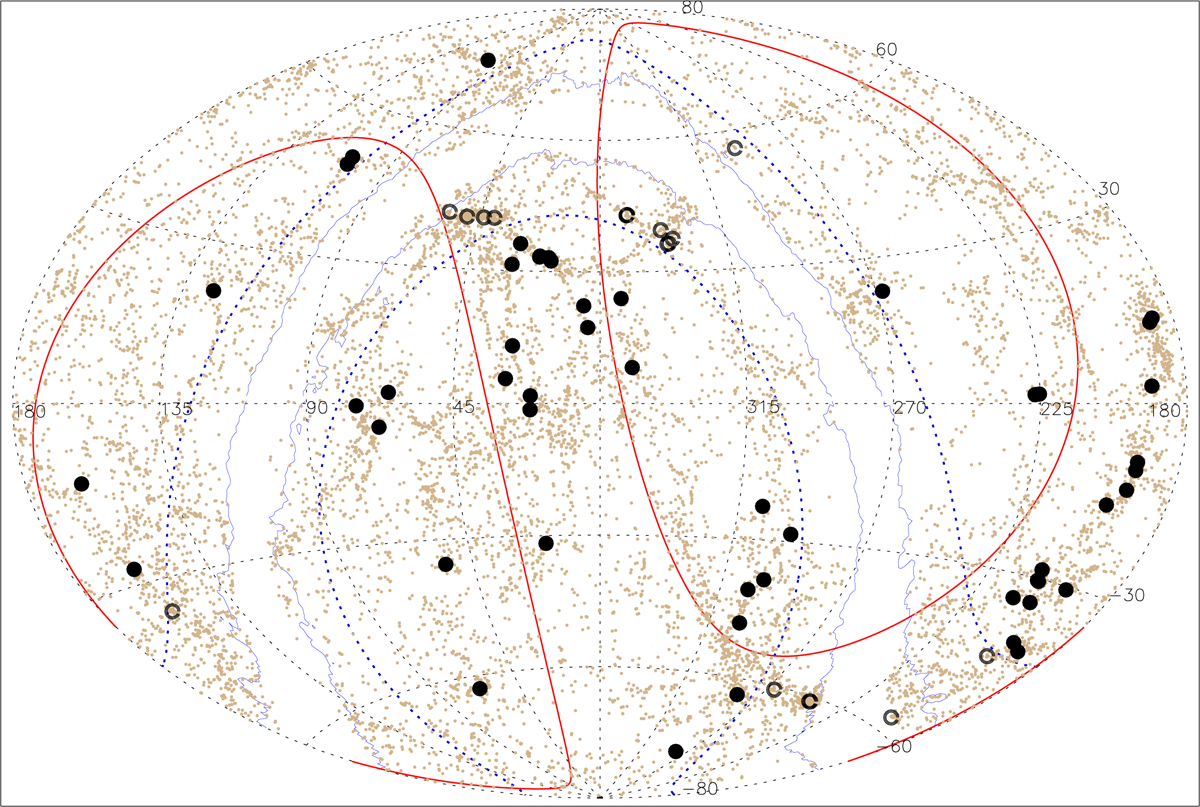
Sky distribution of the CLASSIX galaxy clusters in the redshift range z = 0−0.02 in equatorial coordinates. Clusters in the ZoA are shown as open circles, while all other clusters are marked with filled circles. The small brown dots show the galaxies from the 2MASS redshift survey (Huchra et al. 2012) in the same redshift range. The two black dotted lines show Galactic latitudes of bII = ±20°, the blue lines show the boundaries of the zone of high galactic absorption with a hydrogen column density nH ≥ 2.5 × 1021 cm−2, and the two solid red lines show the Supergalactic latitudes ±20°.
Current usage metrics show cumulative count of Article Views (full-text article views including HTML views, PDF and ePub downloads, according to the available data) and Abstracts Views on Vision4Press platform.
Data correspond to usage on the plateform after 2015. The current usage metrics is available 48-96 hours after online publication and is updated daily on week days.
Initial download of the metrics may take a while.