| Issue |
A&A
Volume 651, July 2021
|
|
|---|---|---|
| Article Number | A1 | |
| Number of page(s) | 7 | |
| Section | Stellar structure and evolution | |
| DOI | https://doi.org/10.1051/0004-6361/202140545 | |
| Published online | 01 July 2021 | |
Orbital and sub-orbital period determination of the candidate high-mass X-ray binary HD 3191
1
Departamento de Física (EPSJ), Universidad de Jaén, Campus Las Lagunillas s/n, A3, 23071 Jaén, Spain
e-mail: This email address is being protected from spambots. You need JavaScript enabled to view it.
2
Departamento de Ingeniería Mecánica y Minera (EPSJ), Universidad de Jaén, Campus Las Lagunillas s/n, A3, 23071 Jaén, Spain
e-mail: This email address is being protected from spambots. You need JavaScript enabled to view it.
3
Departamento de Ciencias Integradas, Centro de Estudios Avanzados en Física, Matemática y Computación, Universidad de Huelva, 21071 Huelva, Spain
e-mail: This email address is being protected from spambots. You need JavaScript enabled to view it.
4
Departament de Física Quàntica i Astrofísica, Institut de Ciències del Cosmos, Universitat de Barcelona, IEEC-UB, Martí i Franquès 1, 08028 Barcelona, Spain
Received:
12
February
2021
Accepted:
23
April
2021
Abstract
Aims. The final aim of this paper is to expand the sparse group of X-ray binaries with gamma-ray counterparts as laboratories to study high-energy processes under physical conditions that periodically repeat.
Methods. A follow-up of a candidate system has been carried out. We applied both photometric and spectroscopic techniques in the optical domain together with a period analysis using the phase dispersion minimisation and CLEAN methods. A tentative period search was also conducted in the gamma-ray domain.
Results. Our main result is having established the binary nature of the optical star and X-ray emitter HD 3191 towards the Fermi gamma-ray source 4FGL J0035.8+6131, the last one proposed to be associated with a blazar of an unknown type. An orbital period close to 16 d is reported for HD 3191 together with a likely rotation, or pulsation, period of about 0.6 d. Although no convincing evidence for the orbital cycle has been found in the Fermi light curve up to now, the confirmed presence of a high-mass X-ray binary towards 4FGL J0035.8+6131 now strengthens the need for caution about its true nature.
Key words: gamma rays: stars / X-rays: binaries / stars: emission-line, Be / stars: individual: HD 3191
© ESO 2021
1. Introduction
Attention was drawn to the bright and luminous star HD 3191 (spectral type B1 IV:nn) a few years ago after the detection of the bright gamma-ray transient Fermi J0035+6131 (Pivato et al. 2016). XMM-Newton observations of the Fermi flaring source location (0.08° radius at 95% confidence) soon identified two main X-ray candidates consistent with it: the radio source 87GB 003232.7+611352 and the luminous star HD 3191 (Pandel & Kaaret 2016). Follow-up studies point to the 87 GB source, also identified as LQAC 008+061 (Souchay et al. 2015), as the most likely counterpart candidate, which is believed to be an active galaxy or quasar serendipitously located behind the Galactic disk (Pandel & Kaaret 2018). However, these authors could not completely rule out the possibility of HD 3191 being associated with the Fermi emitter. The parallax measurement recently provided by the Gaia Early Data Release 3 (EDR3) places this star at a distance of 1.21 ± 0.02 kpc (Gaia Collaboration 2021). In any case, the star’s unabsorbed hard X-ray emission (LX ≃ 2.6 × 1031 erg s−1, based on the Pandel & Kaaret 2018 flux and Gaia distance) strongly points towards a new, but almost quiescent, high-mass X-ray binary system. Optical spectroscopy of HD 3191 by Munari & Valisa (2016), with resolving power of λ/Δλ ∼ 11 000, detected no remarkable peculiarity in its spectrum. The only exception was a radial velocity of −46.0 ± 0.5 km s−1 that, intriguingly, did not match an old previous value of −22 ± 3 km s−1 in the literature (Petrie & Pearce 1961). On the other hand, the Gaia radial velocity is quoted as +72 ± 12 km s−1. These three different velocities are suggestive of a binary system. However, the highly discrepant Gaia value needs to be considered with caution as it was derived using a template spectrum too cold (6500 K) for an early-type star. Nevertheless, other clues about the possible binary nature of HD 3191 come from its proposed runaway behaviour according to Tetzlaff et al. (2011), who analysed its HIPPARCOS astrometry. A slightly higher proper motion is reported in the recent Gaia EDR3, thus rendering it more conceivable that HD 3191 experienced a kick due to a supernova explosion in binary system in the past. Solving this issue is still in need of a better radial velocity determination.
The Large Area Telescope (LAT) on board the orbiting Fermi gamma-ray observatory recently provided new insights on the transient source J0035+6131. The LAT 10 yr source catalogue1 in its second data release (4FGL-DR2) includes it as the source 4FGL J0035.8+6131. The accompanying light curve shows two additional epochs of faint detection in addition to the two flaring intervals analysed by Pandel & Kaaret (2018). This suggests that this GeV source could remain active at faint levels instead of a strict transient behaviour. Nevertheless, the nature of the source still remains open as the 4FGL-DR2 catalogue still classifies it as a blazar of an unknown type. Gamma-ray and soft gamma-ray flaring activity has also been suspected from different Galactic high-mass X-ray binaries, such as the black hole candidate MWC 656 (Casares et al. 2014) or the well-known gamma-ray binary LS I +61 303 (Muñoz-Arjonilla et al. 2009).
In this context, we have devoted some effort to investigating the nature of the secondary counterpart candidate to Fermi J0035+6131/4FGL J0035.8+6131, namely the star HD 3191, whose possible association with the gamma-ray source is still conceivable. Even if unrelated to the Fermi emission, this early-type star is an interesting object by itself in any case. The following sections contain an account of our observational work, in the optical domain, mostly based on our own ground-based observations and the analysis of archival data from space. As a main result, the HD 3191 binary nature is confirmed with an accurate estimate of the orbital period. With this knowledge in hand, the possibility of using the matching period approach is now open to help test the HD 3191 candidacy. Our preliminary search for the signature of the system period in the Fermi data yields, however, non-conclusive results.
2. Spectroscopic and photometric observations from the ground
We started our observational study of HD 3191 at the Observatory of the University of Jaén (OUJA, Martí et al. 2017), whose 41 cm telescope was equipped in late 2019 with a low-resolution LISA spectrograph from Shelyak Instruments (λ/Δλ ∼ 1100), combined with a Peltier cooled ATIK 460EX camera. To our surprise, we noticed the clear presence of an emission line of ionised helium (He II) at the 4686 Å wavelength as illustrated in Fig. 1. This feature in emission is more common in O-type stars than in B-type stars, thus its presence was intriguing. Moreover, this finding had not been previously reported by the spectroscopic observers mentioned above. All of this stimulated our interest to continue our HD 3191 observations. The emission feature was repeatedly detected during the following weeks with different degrees of intensity, which are to be reported elsewhere. Its equivalent width, when most prominently detected in Fig. 1, amounted to about −0.54 Å.
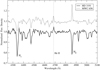 |
Fig. 1. Spectrum of HD 3191 obtained from OUJA on 2019 December 16 and clearly showing the detection of the He II emission line, whose 4686 Å wavelength is marked by the pointed vertical line. The dashed spectrum is shown for comparison purposes and corresponds to the Be black hole system MWC 656. It was observed with the same instrumental setup on 2019 November 18. Balmer lines in the spectral region are also indicated. |
Given that our spectroscopic data lack enough resolution for appropriate radial velocity work, we soon concentrated our efforts on acquiring frequent photometric data. The LISA instrumental setup also allowed us to perform unfiltered photometry by using its secondary guiding camera (Atik 314L+) whose CCD sensor (ICX285AL) has a spectral sensitivity that peaks in approximate coincidence with the Johnson V-band. A simple zero-point was applied to the resulting photometry to approximate the V-band magnitudes. We determined it on a photometric night from reference stars in the open cluster NGC 7790, just a few degrees away from the target. The OUJA photometric data points over 40 nights are reported in Table 1 as a function of heliocentric Julian date (HJD). The check stars within the HD 3191 field of view are not included here, but they remained stable typically within ±0.01 magnitudes.
Results of OUJA differential photometry of HD 3191.
Periodograms of Table 1 photometry were computed using the phase dispersion minimisation (PDM, Stellingwerf 1978) and CLEAN (Roberts et al. 1987) methods. The result is displayed in Fig. 2 where both methods point to the existence of a significant period at 8.19 ± 0.06 days and 8.14 ± 0.05 days, respectively. We soon suspected this to be the signature of an orbital modulation of an ellipsoidal type, as expected from a candidate X-ray binary. If this was the case, then the double-wave symmetry of the ellipsoidal modulation would imply that the true orbital period has to be doubled. The OUJA phase folded light curve is shown in Fig. 3 using twice the best CLEAN period estimate (16.28 d), where hints of this modulation are present. At this stage, phase zero was preliminarily set at HJD 2458749.5 for plotting purposes. All spectroscopic and photometric OUJA frames were processed using IRAF tasks and scripts (Tody 1993).
3. Photometric observations from space
The light curve in Fig. 3 shows a possible double-wave ellipsoidal effect, but with a significant dispersion that could cast doubt on the reality of the orbital period estimated above. This fact prompted us to try to improve the quality of our analysis. At this point, we noticed the availability of HD 3191 in the data releases of the Transiting Exoplanet Survey Satellite (TESS2). The quality of TESS photometry is unprecedented compared to ground based telescopes such as ours. Moreover, it provides a continuous time coverage of several weeks in different sections of the sky and with a time cadence of 2 min. Its wide-field cameras have a 600–1000 nm bandpass, centred on the Cousins IC-band at a wavelength of 7865 Å.
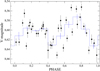 |
Fig. 3. OUJA photometric observations folded on an orbital period of 16.28 d as estimated using CLEAN. The blue dashed line indicates the average with bins of one-tenth the cycle. |
We retrieved all the presearch data conditioning (PDC) data points of HD 3191 from the TESS archive. This includes data from Sectors 17 and 18 obtained during 2019. PDC data take different instrumental corrections into account, such as the focus, pointing, discontinuities due to occasional radiation events, as well as the identification and removal of outlier points. Light-loss and star crowding problems inside the photometric aperture are also dealt with (Jenkins et al. 2016). Nevertheless, this last issue is not a severe problem for HD 3191 since optical stars in its arc-minute vicinity are several magnitudes fainter and none are reported as a variable in the SIMBAD database. Finally, no long-term trend was removed from the PDC files. The corresponding light curve is displayed in the top panel of Fig. 4, where both long-term (days) and short-term (hours) variability is evident. Brightness changes on intra-day timescales are better noticed in the representative zoomed section in the bottom panel of the figure.
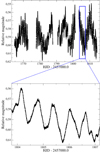 |
Fig. 4. Top: light curve of HD 3191 based on PDC data from the TESS space observatory (Sectors 17 and 18). Bottom: zoomed view of a representative sample of TESS data to illustrate how its time cadence of two minutes enables us to clearly see intra-day variability. |
3.1. Period searches
A periodicity analysis using again PDM and CLEAN is presented in Fig. 5. Here, a (doubled) period very close to sixteen days could be immediately confirmed and, at the same time, improved with respect to OUJA data. The (doubled) period value provided by the two algorithms turned out to be very consistent as they yielded 16.11 ± 0.01 d and 16.09 ± 0.01 d for PDM and CLEAN, respectively. Moreover, both periodograms also unveiled a second significant period related to the short-term variations. These also turned out to repeat with a period estimated as 0.62296 ± 0.00002 d (PDM) and 0.62295 ± 0.00002 d (CLEAN), respectively.
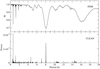 |
Fig. 5. PDM (top) and CLEAN (bottom) periodograms of TESS photometry (Sectors 17 and 18). |
Hereafter, we adopt the TESS CLEAN values of the two periods found for discussion purposes. PDM works fine with non-sinusoidal variations but, as shown below, this is not the case here. The phase origin is the same for both periods, but it has been set to HJD 2458750.14, which is justified later.
3.2. Period stability
In an attempt to assess period stabilities over timescales as long as possible, we explored additional TESS data acquired during 2020 from Sector 24. HD 3191 was also covered then, although with a time sampling of 0.5 h. To assemble a homogeneous dataset, we used the lightkurve software (Lightkurve Collaboration 2018) to process the TESS full frame image (FFI) files for all involved sectors with the same half hour cadence. The resulting light curves for HD 3191 were later cleaned from obvious outliers and shifted to a zero mean before a combined analysis. To support our assessment, we performed a simultaneous least squares fit to the whole FFI dataset of four sine waves at the fundamental frequencies and their harmonics of the two newly found periods. In particular, the sine wave frequencies that were kept fixed in the fit were 0.06215, 0.12430, 1.60527, and 3.21053 d−1, which were derived from the above period analysis of only PDC Sectors 17 and 18. The modulation reconstructed using these sine waves mitigates the uncomplete sampling of the cycles. In Figs. 6 and 7, we compare the first and second pair of sine components with the whole FFI dataset folded and averaged on the long and short period, respectively. Here, it is remarkable that sine waves with the original frequencies are also able to provide a good average description of TESS photometry with sectors separated by nearly half a year. This fact strongly suggests that the 16 and 0.6 d periods do indeed remain stable over timescales of at least several months.
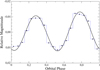 |
Fig. 6. Comparison of the modulation due to 0.06215 and 0.12430 d−1 sine waves with the FFI photometry of HD 3191 from TESS Sectors 17, 18, and 24 folded on the 16.09 d period and averaged using 0.05 phase bins. The phase origin adopted is HJD 2458750.14. |
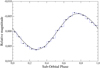 |
Fig. 7. Comparison of the modulation due to 1.60527 and 3.21053 d−1 sine waves with the FFI photometry of HD 3191 from TESS Sectors 17, 18, and 24 folded on the 0.62295 d period and averaged using 0.05 phase bins. The same zero phase as in the previous figure has been arbitrarily adopted. |
4. Discussion
Here we adopt MV = − 3.28 and BC = − 2.67 mag as the absolute magnitude and bolometric correction appropriate for a B1 IV star, respectively (Wegner 2006; Nieva 2013). At the Gaia distance, this yields a star bolometric luminosity of the Lbol ≃ 7.3 × 1037 erg s−1. Therefore we obtain the ratio LX/Lbol ≃ 4 × 10⁻⁷ that is consistent with the ‘canonical’ value typical of O-type and early B-type stars (Berghoefer et al. 1997). It is worth pointing out here that binaries in B-type stars do not appear significantly X-ray brighter than single objects, thus leaving room for undiscovered companions (Nazé 2009).
The unexpected detection of an emission line of He II (4686 Å) in Fig. 1 immediately prompted us to consider a parallelism of HD 3191 with the binary system MWC 656, which also exhibits such spectral feature arising in the accretion disk around its black hole companion (Casares et al. 2014). We also have to recall here that both systems appear towards the direction of flaring gamma-ray sources, with which they could have a connection. Moreover, their respective spectral types are very similar, around B1-B2 with a giant and subgiant luminosity class, except for the fact that MWC 656 also belongs to the Be star group with strong Hα emission from a circumstellar envelope.
In any case, the strongest point of this work supporting the binary nature of HD 3191 is the clear detection of a nearly two-week period whose value fits well within the typical range of orbital periods in high-mass X-ray binaries (Liu et al. 2006). At this point, we propose that 16.09 ± 0.01 d is likely to correspond to the orbital cycle of HD 3191, which could harbor a compact companion eventually responsible for the He II emission as in MWC 656.
4.1. Understanding the HD 3191 optical light curve
To reinforce the binarity statement, we must pay further attention to the light curve appearance where one expects to see the typical double-wave pattern of ellipsoidal variability in massive X-ray binary systems. Hints of ellipsoidal variability were already suspected from OUJA photometry in Fig. 3. However, the TESS light curve in Fig. 4 shows that variability over the proposed orbital period is strongly distorted due to a second, short-term, sub-orbital period whose origin has yet to be established. To mitigate this problem, we decided to proceed by averaging the TESS light curve with bins of 1/20 of the long-term period. The result is shown in Fig. 8, where we have also fitted a synthetic light curve based on a simplified version of the Wilson & Devinney (1971) code. The Fortran programme used was written by the corresponding author following the detailed equation formalism in Hilditch (2001). In Fig. 8, the phase origin chosen in the previous section ensures that the zero orbital phase coincides with the inferior conjunction of the primary star.
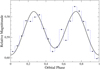 |
Fig. 8. Tentative attempt to model the average orbital light curve in terms of ellipsoidal variability due to the distorted primary star, as explained in the text. Only PDC photometry of TESS Sectors 17 and 18 was was used in the fit. Bins of the 0.05 phase are shown. |
Our custom code assumes, for simplicity, a circular orbit. The physical effects taken into account include both gravity and limb darkening. Moreover, no reflection effects are considered in view of the low X-ray luminosity of the system. The optical companion was kept with fixed values of its mass M1 = 15 M⊙ and effective temperature T1 = 25000 K, appropriate for its spectral type and luminosity class. In addition, the mass of the companion was set at a plausible value of M2 = 3 M⊙ and assumed to be a compact object (normalised surface potential Φn, 2 → ∞) with an optical contribution from any accretion disk being neglected. A summary of all relevant parameters used (both fixed and fitted) is condensed in Table 2.
Synthetic light curve parameters of HD 3191.
Despite the crudeness of our tentative fit, it manages to reproduce the general trend of the averaged light curve. This fact encourages us to accept the idea that the 16 d periodic modulation in HD 3191 is of ellipsoidal origin. For the parameters in Table 2, Roche lobe overflow would occur for normalised surface potential Φn, 1 = 3.75. The fitted value obtained turns out to be above, but not far from, this threshold (actually 2.7 standard deviations). Therefore, HD 3191 appears to be prone to possible mass-transfer episodes through the inner Lagrangian point that could eventually lead to possible transient Fermi emission.
Concerning the short-term, sub-orbital period in HD 3191, the most natural interpretation is in terms of rotation or pulsation. Its average behaviour is well represented by a pure sinusoidal function with an amplitude of 0.01 mag, as shown in Fig. 9. Among the two possible scenarios, we first consider the one based on rotation because of the 0.6 d period persistency over several month scales, its proposed detection in a few gamma-ray binaries (Zamanov et al. 2021), and the abundant rotation evidences found by the TESS observatory, not only in A-type stars, but also in B-type ones such as ours (Balona et al. 2019). The fraction of rotational variables reported appears to be similar in both spectral types (about 40%). The rotational frequency in HD 3191 (νrot = 1.6 d−1) agrees well with the range of values within the B-type rotating variables. A B1 IV is expected to have a surface gravity with log g = 4.05 (Nieva 2013), which implies a radius of about 6 R⊙. The observed sub-orbital period would then correspond to a rotation velocity close to 70% of the break-up limit. Actually, fast stellar rotation would not come as a surprise given the spectral classification of HD 3191 in the literature with a suffix of nn used for rotationally broadened spectral lines. In this scenario, the physical cause of the photometric modulation would be due to the presence of starspots, which would also exist in early-type stars and not only in those of late-type, such as RS Canis Venaticorum systems. These structures would arise as a result of magnetic fields in the sub-surface convective zone of hot stars (Cantiello et al. 2009), but their lifetime in early-type stars is not expected to last as long as our persistent sub-orbital period (Rauw & Nazé 2021). However, if large-scale magnetic fields are generated by extreme dynamo effects, then these magnetic structures could be stable on a much longer timescale, of approximately a year, at least for late B-type stars (Cantiello & Braithwaite 2019). In any case, the surface brightness distribution that would lead to a nearly-perfect sinusoidal modulation in a rotation scenario is not a trivial issue. For instance, the lack of synchronism between the rotation and the orbital period would compromise the assumption of a Roche potential star shape implicit in codes of Wilson & Devinney type.
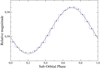 |
Fig. 9. Sinusoidal fit to the averaged light curve of HD 3191 folded on the short-term variability period. Only PDC photometry of TESS Sectors 17 and 18 is included. Bins of the 0.05 phase are used. |
The alternative interpretation of the sub-orbital period could be in terms of non-radial pulsation modes, known to be a long-lived stellar phenomenon. Indeed, the luminosity and log g values quoted before HD 3191 are within the instability strip region as predicted by Godart et al. (2017). The wide profile of absorption lines in its optical spectrum would then be reflecting non-rotational line-broadening effects or macroturbulent broadening, also occurring in O stars and B supergiants according to these authors. Here we speculate if enhanced pulsation, combined with even moderate eccentricity effects, could provide the necessary kick-off to trigger occasional mass-transfer episodes by Roche lobe overflow. Discriminating among rotation or pulsation scenarios could be addressed with accurate spectral modelling in the future.
4.2. Is HD 3191 a runaway star?
The modern Gaia EDR3 data can shed light on this issue already quoted in the introduction which was first considered by Tetzlaff et al. (2011). Using the latest astrometric information available and the equation formalism given by Moffat et al. (1998), it is possible to estimate the peculiar tangential velocity of the star vpec. This velocity component is the residual left when the proper motion due to Galactic rotation and Sun motion with respect to the local standard of rest is subtracted from the observed heliocentric proper motion. The stellar distance is assumed to be known in the calculation. Runaway candidacy is considered to be likely if this residual exceeds about 42 km s−1 plus the standard deviation of vpec.
In our case, we obtain vpec = 5.9 ± 0.5 km s−1 using Gaia EDR3. This result strongly argues against the runaway nature of HD3191 and agrees with the fact that Tetzlaff et al. (2011) could not confirm it as a runaway with historical HIPPARCOS data. Nevertheless, an estimate for the systemic radial velocity of the binary system is required to definitively determine whether or not it is a runaway. This motion along the line of sight could still provide a significant contribution to the modulus of the peculiar velocity with respect to the HD 3191 regional standard of rest.
4.3. Search for the orbital period in Fermi data
We have tried to find evidence for the proposed orbital period in the Fermi light curve of 4FGL J0035.8+6131, which could definitely set a positive identification. According to our ephemeris, the two strong gamma-ray flares around MJD 57067 and MJD 57402 (Pandel & Kaaret 2018) covered the orbital phase ranges from 0.39–0.42 and 0.18–0.26, respectively. Their overlap is marginal but suggestive at the 2σ level when considering the propagated uncertainty of 0.06 orbital cycles.
To gain further insight, we obtained the Fermi-LAT fluxes in the energy range 0.3–10 GeV where the gamma-ray source is better detected. They were generated with the latest version of the Fermi Science Tools (2.0.0 released on September 21, 2020). In order to be rigorous, instead of aperture photometry, we used a likelihood analysis approach with a 10° radius around the position of 4FGL J0035+6131. The adopted start and end times were 54682.65603 and 59167.51686 in the modified Julian day (MJD) scale with a time binning interval of 3 d. We also applied the perl script like_lc.pl3 created by R. Corbet, using the current P8 R3 data, including the gll_iem_v07 Galactic diffuse model and the iso_P8R3_SOURCE_V3_v1 isotropic spectral template, as well as nearby sources in the last gll_psc_v27.fit Fermi-LAT catalogue. Finally, a simple power-law energy spectrum was fitted setting all parameters of the model fit to fixed, except the index and the integral of the target source.
The resulting light curve turned out to be rather noisy, except at times of previously known flares. The result of a PDM periodogram is displayed in Fig. 10. Unfortunately, the signature of the sixteen day orbital period is not confidently detected with the present data set. Several of the deepest minima in the periodogram are of instrumental nature and related to the 53 d precession period of the satellite and its harmonics. Yet, this does not strictly rule out the possible association with HD 3191 as the suspected gamma-ray emission is clearly not a steady one.
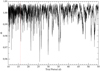 |
Fig. 10. PDM analysis of the Fermi-LAT curve of 4FGL J0035.8+6131 in the 0.3–10 GeV energy range. The red vertical line marks the expected location of the orbital period of HD 3191 where no clear signal is present. |
5. Conclusions
An extended observational study of the gamma-ray source 4FGL J0035.8+6131 focused on its candidate counterpart HD 3191 has been presented. Our main conclusions can be summarized as follows:
-
We have reported strong photometric evidence on the binary nature of the early-type star HD 3191. This finding supports its previously proposed classification as an X-ray binary system. Two clear periodic modulations, close to 16 d and 0.6 d, are evident in the HD 3191 optical light curve. Their most likely interpretation is in terms of the orbital and rotational or pulsation cycle of the optical companion, respectively.
-
Spectroscopic observations have revealed an interesting parallelism between HD 3191 and the black hole X-ray binary MWC 656. Both are showing a HeII 4686 Å emission line and have been tentatively associated with different flaring gamma-ray sources. In this context, the possible connection of HD 3191 with the Fermi source 4FGL J0035.8+6131, instead of a blazar identification, remains a very conceivable one. The helium emission in HD 3191 could be related to a compact companion as in MWC 656. An extensive radial velocity monitoring is necessary to confirm or rule out this suspicion.
-
Photometric modelling tentatively suggests that the system is below, but close to Roche lobe overflow. Enhanced mass-transfer episodes, triggered by pulsation effects or a slightly eccentric orbit, could eventually play a role in occasional high-energy emission events.
-
A few km s−1 value has been obtained for the HD 3191 peculiar tangential velocity with respect to its environments, thus suggesting that we are not dealing with a runaway system.
-
A search for the orbital period in the 4FGL J0035.8+6131 light curve has produced negative results that prevent, so far, an unambiguous association with the HD 3191 system.
The confirmation of HD 3191 as a binary is possibly the most important contribution of this paper. This is because it now opens the opportunity to attempt the orbital period detection in future improved Fermi-LAT data sets.
Acknowledgments
We thank an anonymous referee for helping to improve this paper. This work was mainly supported by grant PID2019-105510GB-C32 / AEI / 10.13039/501100011033 from State Agency for Research of the Spanish Ministry of Science and Innovation entitled High energy sources with outflows at different scales: observation of galactic sources. We also acknowledge support by Consejería de Economía, Innovación, Ciencia y Empleo of Junta de Andalucía as research group FQM- 322, as well as FEDER funds. JMP acknowledges financial support from the State Agency for Research of the Spanish Ministry of Science and Innovation under grant PID2019-105510GB-C31 and through the Unit of Excellence María de Maeztu 2020-2023 award to the Institute of Cosmos Sciences (CEX2019-000918-M), and by the Catalan DEC grant 2017 SGR 643. This paper includes data collected with the TESS mission, obtained from the MAST data archive at the Space Telescope Science Institute (STScI). Funding for the TESS mission is provided by the NASA Explorer Programme. STScI is operated by the Association of Universities for Research in Astronomy, Inc., under NASA contract NAS 5-26555. This research has made use of the SIMBAD database, operated at CDS, Strasbourg, France. This work has also made use of data from the European Space Agency (ESA) mission Gaia (https://www.cosmos.esa.int/gaia), processed by the Gaia Data Processing and Analysis Consortium (DPAC, https://www.cosmos.esa.int/web/gaia/dpac/consortium). Funding for the DPAC has been provided by national institutions, in particular the institutions participating in the Gaia Multilateral Agreement.
References
- Balona, L. A., Handler, G., Chowdhury, S., et al. 2019, MNRAS, 485, 3457 [CrossRef] [Google Scholar]
- Berghoefer, T. W., Schmitt, J. H. M. M., Danner, R., & Cassinelli, J. P. 1997, A&A, 322, 167 [Google Scholar]
- Cantiello, M., & Braithwaite, J. 2019, ApJ, 883, 106 [CrossRef] [Google Scholar]
- Cantiello, M., Langer, N., Brott, I., et al. 2009, A&A, 499, 279 [NASA ADS] [CrossRef] [EDP Sciences] [Google Scholar]
- Casares, J., Negueruela, I., Ribó, M., et al. 2014, Nature, 505, 378 [Google Scholar]
- Gaia Collaboration (Brown, A. G. A., et al.) 2021, A&A, 649, A1 [NASA ADS] [CrossRef] [EDP Sciences] [Google Scholar]
- Godart, M., Simón-Díaz, S., Herrero, A., et al. 2017, A&A, 597, A23 [NASA ADS] [CrossRef] [EDP Sciences] [Google Scholar]
- Hilditch, R. W. 2001, An Introduction to Close Binary Stars [CrossRef] [Google Scholar]
- Jenkins, J. M., Twicken, J. D., McCauliff, S., et al. 2016, in Software and Cyberinfrastructure for Astronomy IV, eds. G. Chiozzi, & J. C. Guzman, SPIE Conf. Ser., 9913, 99133E [Google Scholar]
- Lightkurve Collaboration (Cardoso, J. V. d. M., et al.) 2018, Astrophysics Source Code Library [record ascl:1812.013] [Google Scholar]
- Liu, Q. Z., van Paradijs, J., & van den Heuvel, E. P. J. 2006, A&A, 455, 1165 [NASA ADS] [CrossRef] [EDP Sciences] [Google Scholar]
- Martí, J., Luque-Escamilla, P. L., & García-Hernández, M. T. 2017 Bulgarian Astron. J., 26, 91 [Google Scholar]
- Moffat, A. F. J., Marchenko, S. V., Seggewiss, W., et al. 1998, A&A, 331, 949 [NASA ADS] [Google Scholar]
- Munari, U., & Valisa, P. 2016, ATel., 8789, 1 [Google Scholar]
- Muñoz-Arjonilla, A. J., Martí, J., Combi, J. A., et al. 2009, A&A, 497, 457 [NASA ADS] [CrossRef] [EDP Sciences] [Google Scholar]
- Nazé, Y. 2009, A&A, 506, 1055 [NASA ADS] [CrossRef] [EDP Sciences] [Google Scholar]
- Nieva, M. F. 2013, A&A, 550, A26 [NASA ADS] [CrossRef] [EDP Sciences] [Google Scholar]
- Pandel, D., & Kaaret, P. 2016, ATel., 8783, 1 [Google Scholar]
- Pandel, D., & Kaaret, P. 2018, ApJ, 862, 83 [CrossRef] [Google Scholar]
- Petrie, R. M., & Pearce, J. A. 1961, Publ. Dominion Astrophys. Obs. Victoria, 12, 1 [Google Scholar]
- Pivato, G., Buson, S., & Razzan, M. 2016, ATel., 8554, 1 [Google Scholar]
- Rauw, G., & Nazé, Y. 2021, MNRAS, 500, 2096 [CrossRef] [Google Scholar]
- Roberts, D. H., Lehar, J., & Dreher, J. W. 1987, AJ, 93, 968 [Google Scholar]
- Souchay, J., Andrei, A. H., Barache, C., et al. 2015, A&A, 583, A75 [NASA ADS] [CrossRef] [EDP Sciences] [Google Scholar]
- Stellingwerf, R. F. 1978, ApJ, 224, 953 [Google Scholar]
- Tetzlaff, N., Neuhäuser, R., & Hohle, M. M. 2011, MNRAS, 410, 190 [Google Scholar]
- Tody, D. 1993, in Astronomical Data Analysis Software and Systems II, eds. R. J. Hanisch, R. J. V. Brissenden, & J. Barnes, ASP Conf. Ser., 52, 173 [Google Scholar]
- Wegner, W. 2006, MNRAS, 371, 185 [NASA ADS] [CrossRef] [Google Scholar]
- Wilson, R. E., & Devinney, E. J. 1971, ApJ, 166, 605 [NASA ADS] [CrossRef] [Google Scholar]
- Zamanov, R. K., Stoyanov, K. A., Marti, J., Marchev, V. D., & Nikolov, Y. M. 2021, Astron. Nachr., 342, 531 [CrossRef] [Google Scholar]
All Tables
All Figures
|
Fig. 1. Spectrum of HD 3191 obtained from OUJA on 2019 December 16 and clearly showing the detection of the He II emission line, whose 4686 Å wavelength is marked by the pointed vertical line. The dashed spectrum is shown for comparison purposes and corresponds to the Be black hole system MWC 656. It was observed with the same instrumental setup on 2019 November 18. Balmer lines in the spectral region are also indicated. |
| In the text | |
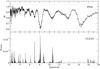 |
Fig. 2. PDM (top) and CLEAN (bottom) periodograms of OUJA photometry in Table 1. |
| In the text | |
|
Fig. 3. OUJA photometric observations folded on an orbital period of 16.28 d as estimated using CLEAN. The blue dashed line indicates the average with bins of one-tenth the cycle. |
| In the text | |
|
Fig. 4. Top: light curve of HD 3191 based on PDC data from the TESS space observatory (Sectors 17 and 18). Bottom: zoomed view of a representative sample of TESS data to illustrate how its time cadence of two minutes enables us to clearly see intra-day variability. |
| In the text | |
|
Fig. 5. PDM (top) and CLEAN (bottom) periodograms of TESS photometry (Sectors 17 and 18). |
| In the text | |
|
Fig. 6. Comparison of the modulation due to 0.06215 and 0.12430 d−1 sine waves with the FFI photometry of HD 3191 from TESS Sectors 17, 18, and 24 folded on the 16.09 d period and averaged using 0.05 phase bins. The phase origin adopted is HJD 2458750.14. |
| In the text | |
|
Fig. 7. Comparison of the modulation due to 1.60527 and 3.21053 d−1 sine waves with the FFI photometry of HD 3191 from TESS Sectors 17, 18, and 24 folded on the 0.62295 d period and averaged using 0.05 phase bins. The same zero phase as in the previous figure has been arbitrarily adopted. |
| In the text | |
|
Fig. 8. Tentative attempt to model the average orbital light curve in terms of ellipsoidal variability due to the distorted primary star, as explained in the text. Only PDC photometry of TESS Sectors 17 and 18 was was used in the fit. Bins of the 0.05 phase are shown. |
| In the text | |
|
Fig. 9. Sinusoidal fit to the averaged light curve of HD 3191 folded on the short-term variability period. Only PDC photometry of TESS Sectors 17 and 18 is included. Bins of the 0.05 phase are used. |
| In the text | |
|
Fig. 10. PDM analysis of the Fermi-LAT curve of 4FGL J0035.8+6131 in the 0.3–10 GeV energy range. The red vertical line marks the expected location of the orbital period of HD 3191 where no clear signal is present. |
| In the text | |
Current usage metrics show cumulative count of Article Views (full-text article views including HTML views, PDF and ePub downloads, according to the available data) and Abstracts Views on Vision4Press platform.
Data correspond to usage on the plateform after 2015. The current usage metrics is available 48-96 hours after online publication and is updated daily on week days.
Initial download of the metrics may take a while.