Free Access
Fig. 8.
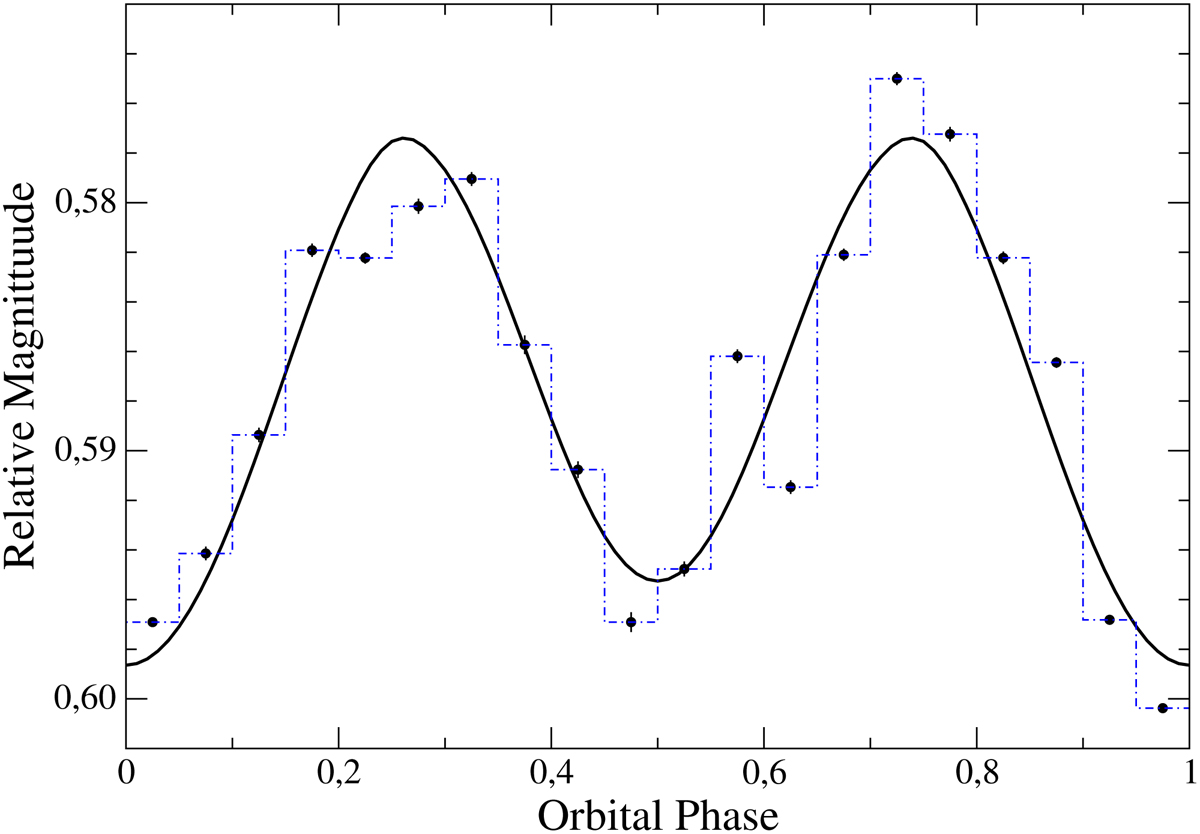
Tentative attempt to model the average orbital light curve in terms of ellipsoidal variability due to the distorted primary star, as explained in the text. Only PDC photometry of TESS Sectors 17 and 18 was was used in the fit. Bins of the 0.05 phase are shown.
Current usage metrics show cumulative count of Article Views (full-text article views including HTML views, PDF and ePub downloads, according to the available data) and Abstracts Views on Vision4Press platform.
Data correspond to usage on the plateform after 2015. The current usage metrics is available 48-96 hours after online publication and is updated daily on week days.
Initial download of the metrics may take a while.