| Issue |
A&A
Volume 662, June 2022
|
|
|---|---|---|
| Article Number | A27 | |
| Number of page(s) | 6 | |
| Section | Stellar structure and evolution | |
| DOI | https://doi.org/10.1051/0004-6361/202243318 | |
| Published online | 06 June 2022 | |
Optical microflares in LS I +61 303 and the search for their multiwavelength counterpart
1
Departamento de Física (EPSJ), Universidad de Jaén, Campus Las Lagunillas s/n, A3, 23071 Jaén, Spain
e-mail: This email address is being protected from spambots. You need JavaScript enabled to view it.
2
Departamento de Ciencias Integradas, Centro de Estudios Avanzados en Física, Matemática y Computación, Universidad de Huelva, 21071 Huelva, Spain
3
Departamento de Ingeniería Mecánica y Minera (EPSJ), Universidad de Jaén, Campus Las Lagunillas s/n, A3, 23071 Jaén, Spain
4
Departament de Física Quàntica i Astrofísica, Institut de Ciències del Cosmos (ICCUB), Universitat de Barcelona, IEEC-UB, Martí i Franquès 1, 08028 Barcelona, Spain
5
Observatori Fabra, Reial Acadèmia de Ciències i Arts de Barcelona, Rambla dels Estudis, 115, 08002 Barcelona, Spain
Received:
12
February
2022
Accepted:
29
April
2022
Abstract
Context. Stellar sources of gamma rays are one of the front lines in modern astrophysics whose understanding can benefit from observational tools not originally designed for their study.
Aims. We take advantage of the high precision photometric capabilities of present-day space facilities to obtain a new perspective on the optical behavior of the X-ray and gamma-ray binary LS I +61 303. Previously unknown phenomena whose effects manifest with amplitudes below 0.01 magnitude can now be clearly observed and studied.
Methods. Our work is mainly based on the analysis of optical and gamma-ray archival data and uses the tools recommended by the different collaborations that provide these valuable observational resources (in particular, the TESS and Fermi orbiting observatories). In addition, complementary ground-based optical spectroscopy has also been conducted.
Results. We report the discovery of small-amplitude optical flares on timescales of a day in the LS I +61 303 light curve. Different alternative scenarios to explain their origin are tentatively proposed.
Key words: stars: flare / gamma rays: stars / X-rays: binaries / stars: emission-line, Be / stars: individual: LS I +61 303
© E. Mestre et al. 2022
 Open Access article, published by EDP Sciences, under the terms of the Creative Commons Attribution License (https://creativecommons.org/licenses/by/4.0), which permits unrestricted use, distribution, and reproduction in any medium, provided the original work is properly cited.
This article is published in open access under the Subscribe-to-Open model. This email address is being protected from spambots. You need JavaScript enabled to view it. to support open access publication.
1. Introduction
LS I +61 303 is a high mass X-ray binary that consists of a B0 Ve star (Casares et al. 2005) and a compact object whose nature has remained unknown for decades. Very recently, the detection of radio pulsations provides evidence in favor of a rotating neutron star and against the alternative black hole option (Weng et al. 2022). Its distance was first estimated as ∼2 kpc (Frail & Hjellming 1991). The binary system orbital parameters best indicate a highly eccentric orbit (e = [0.5−0.72]) with periastron at phase [0.23−0.3] (Hutchings & Crampton 1981; Casares et al. 2005; Grundstrom et al. 2007). Be stars present slow equatorial outflows in the form of a thin disk (Waters et al. 1988). In the case of LS I +61 303, the companion star mass has been estimated as 10–15 M⊙ for an orbital inclination i < 60° (Casares et al. 2005).
The high radio variability of LS I +61 303 was first reported in 1978, during a Galactic plane survey for highly variable radio sources (Gregory & Taylor 1978). Soon after, a ∼26.5 day periodic modulation of its radio emission, corresponding to the binary system orbital period, was noticed (Taylor & Gregory 1982; Gregory 2002). The commonly used zero phase epoch dates back to the first detection in the radio (Gregory & Taylor 1978). Super-orbital radio variability was also found with a ∼4 yr modulation of the radio outburst peak (Paredes 1987; Martí & Paredes 1995; Gregory 2002). In contrast, small-amplitude radio variability has been reported down to timescales of ≈1.4 h during the flux decay soon after the expected periodic radio outburst (Peracaula et al. 1997). The existence of precessing collimated radio jets has been claimed from high-resolution (20−50 ms) radio interferometric observations (Massi et al. 2004, 2001), which would support a microquasar scenario. Multiple models (both leptonic and hadronic) have been proposed within this context to account for the broadband emission of LS I +61 303 (Bosch-Ramon et al. 2006; Gupta & Boettcher 2006; Dermer & Böttcher 2006; Bednarek 2006a,b; Romero et al. 2005; Torres & Halzen 2007). Other competing scenarios proposed to explain the emission from the source are the “colliding winds” models, in which the compact object is a young pulsar losing energy via relativistic wind (Maraschi & Treves 1981; Dubus 2006; Romero et al. 2007; Zdziarski et al. 2010). A shock forms in the boundary between the pulsar wind and the companion stellar wind, where synchrotron emitting leptons can be accelerated to later interact via inverse Compton with the Be companion photon field.
The orbital modulation of LS I +61 303 is also seen in other wavelength domains. The optical variability, first reported by Paredes & Figueras (1986), was later shown by Mendelson & Mazeh (1989) to follow the orbital period. A similar behavior is present in X-rays as well (Paredes et al. 1997). The X-ray counterpart, originally detected with the Einstein satellite (Bignami et al. 1981), has been extensively observed at these energies (with multiple instruments, including ROSAT, ASCA, RXTE, XMM-Newton, INTEGRAL, Swift/XRT, and Chandra; Goldoni & Mereghetti 1995; Leahy et al. 1997; Harrison et al. 2000; Chernyakova et al. 2006; Sidoli et al. 2006; Esposito et al. 2007; Paredes et al. 2007; Torres et al. 2012; Li et al. 2012). X-ray flux variations have been reported on timescales of days (Goldoni & Mereghetti 1995; Taylor et al. 1996) and shorter (Li et al. 2011). Via high-energy (HE) gamma rays, Fermi-LAT (Abdo et al. 2009) detected the modulated GeV emission of the source, revealing periodic outbursts slightly after the periastron passage (ϕ ∼ 0.3−0.45 Hadasch et al. 2012).
Finally, at very high energies, the source was first detected with MAGIC (Albert et al. 2006) and later observed in different campaigns (Acciari et al. 2008; Albert et al. 2009; Aleksić et al. 2012). The TeV peak has been detected at phases close to the apastron (ϕ ∼ 0.6−0.7) at a flux level of up to 16% of the Crab Nebula above 400 GeV.
In this work we report optical microflares on a daily timescale during an orbital period of LS I +61 303 with the Transiting Exoplanet Survey Satellite (TESS) and the search for their counterparts via HE gamma rays with the Fermi Large Area Telescope (LAT). We describe the optical observations in Sect. 2 and summarize the LAT data analysis in Sect. 3. Finally, Sect. 4 is devoted to a discussion and conclusions.
2. Optical observations and analysis
2.1. Space-based photometry
LS I +61 303 was included in the field of view of TESS1 during almost a full orbital cycle in Sector 18 observed in November 2019. This space observatory provides continuous multi-target optical photometry in the 600–1000 nm range centered on the Cousins IC band at a wavelength of 786.5 nm. With an exposure time of 1426 s, TESS enables an unprecedented sampling of the LS I +61 303 behavior at optical wavelengths.
The LS I +61 303 light curve was generated using the standard data reduction tools provided by the TESS team (Lightkurve Collaboration 2018), starting from the full frame image files. Special care was taken to make sure that effects of nearby stars did not affect the final result, which is presented in the top panel of Fig. 1. The pixel level de-correlation technique (Deming et al. 2015) was also taken into account, but only minor differences were seen. Remarkably, the resulting light curve shows both a long-term variability trend over the orbital cycle and short-term, rapid (∼1 day) small-amplitude fluctuations of ∼0.01−0.02 mag.
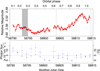 |
Fig. 1. Simultaneous optical and gamma-ray light curves. Top panel: TESS light curve of LS I +61 303 in November 2019 with a binning time of half an hour. The vertical lines represent the dates when optical spectroscopy was obtained. The black shaded area comprises the periastron phase, which has been located within the interval [0.23–0.3]. The top horizontal axis gives the orbital phase of the data computed using the 26.496 d orbital period and phase origin on Julian date 2443366.775. The vertical axis is plotted in terms of relative magnitude, computed as −2.5log(TESS count rate) plus an arbitrary zero point, for easier comparison with historical photometric studies that use magnitudes instead of flux. Bottom panel: in blue points, the Fermi-LAT photon flux of 4FGL J0240.5+6113 computed in bins of 32.9 h in the same orbital period as the optical data (with only statistical errors). The black dots stand for the source detection significance ( |

The optical microflares we report from the TESS data of LS I +61 303, detected on daily timescales, constitute a newly observed feature in the emission from this remarkable system. We used a continuous wavelet-based approach to detect temporal coherent patterns in our nonstationary observations (see, for instance, Burrus et al. 1998). A Morlet mother wavelet with wavenumber 8 was chosen for a better compromise between time and frequency resolution. Only frequencies higher than 0.5 Hz were explored. The spectrogram that shows the mean squared amplitude power appears in Fig. 2 on a normalized scale. In it, a slowly evolving periodicity pattern with a recurrence interval of ∼1 day can be seen. Microflares appear to repeat slightly faster (∼10%) in the vicinity of periastron passage and slow down when approaching apastron.
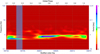 |
Fig. 2. Wavelet analysis of the LS I +61 303 light curve. The vertical shaded region represents the estimated periastron passage region. |
Concerning the shortest timescales of optical variability, in Fig. 3 it can be seen that some flare rises and decays occur on timescales of τ ∼ 0.1 days, which are interestingly reminiscent of previously observed fast radio variability (Peracaula et al. 1997). Given the finite speed of light, an upper limit to the size of the flaring region is cτ ∼ 17 AU.
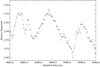 |
Fig. 3. Zoomed-in view of a sector of the TESS light curve, showing the shortest timescales of variability. Error bars are smaller than 1 millimagnitude. |
2.2. Ground-based spectroscopy
In parallel, low-resolution optical spectroscopy of LS I +61 303 was fortunately obtained in coincidence with the TESS monitoring using the 41 cm telescope at the Observatory of the University of Jaén (Martí et al. 2017), equipped with a LISA spectrograph from Shelyak Instruments. Data reduction and wavelength calibration using Ne lamps were performed by means of standard IRAF tools. Spectra acquisition took place on November 16 and 27, 2019 (MJD 58803.85 and 58814.80), and they are shown in Fig. 4 around the Hα feature. The emission line flux remained nearly constant at the 2.8 × 10⁻¹² erg s−1 cm−2 level with an average equivalent width of −13.6 Å (estimated uncertainty 10%).
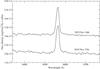 |
Fig. 4. Optical spectra of LS I +61 303 contemporaneous to the TESS monitoring. |
3. Gamma-ray observations and analysis
We downloaded the Fermi-LAT (P8R3; Atwood et al. 2013; Bruel et al. 2018) data toward LS I +61 303 (securely identified with the LAT gamma-ray source 4FGL J0240.5+6113; Abdo et al. 2009) recorded from September 8, 2016, to September 8, 2021 (or 494995769–652762170 s in Fermi mission elapsed time). This time interval fully overlaps with the TESS pointing. The selected region of interest (ROI) is defined by a radius of 15° centered around the position of 4FGL J0240.5+6113 (RA = 40.13° and Dec = 61.23°; Abdo et al. 2009). We analyzed only the dubbed SOURCE class events at energies from 100 MeV (to avoid events poorly reconstructed due to the large angular resolution) to 500 GeV, with a maximum zenith angle of 90° to eliminate Earth limb events.
3.1. Getting an LS I +61 303 improved gamma-ray spectrum
The model fitted to the LAT data described above includes all the LAT sources listed in the Fermi-LAT Fourth Source Catalog (4FGL; Abdollahi et al. 2020) within a 20° radius around the ROI center, plus the Galactic and extra-galactic diffuse gamma-ray components described with the latest available version of the Galactic (gll_iem_v07) and isotropic (iso_P8R3_SOURCE_V3_v1) diffuse emission models. The model’s free parameters correspond to those of the sources within 5° of the position of 4FGL J0240.5+6113, the parameters regarding the isotropic and Galactic diffuse emission models, and the normalization parameter of all the sources in the model with a test statistic greater than ten (TS > 10). The test statistic is defined from the maximum likelihood function value over the ROI when including the source in the model (L) and if accounting only for background (L0), that is, TS = 2log(L/L0) (see Mattox et al. 1996). Therefore, the value of  is usually interpreted as the detection significance of the source.
We analyzed the available LAT data by means of a joint likelihood fitting process using the FERMIPY PYTHON package (version 1.0.1), which is based on the FERMI SCIENCE TOOLS (Wood et al. 2017). The response of the LAT instrument was evaluated with the instrument response functions (version P8R3_SOURCE_V2), applying the energy dispersion correction to all the sources in the model (except for the isotropic diffuse emission). We performed the analysis with the data binned in eight energy bins per decade and spatial bins of 0.1° in size.
We fitted the spectral energy distribution of the source with the FERMIPY extension method which is based on a likelihood ratio test with respect to the point-source hypothesis to both a log-parabola (dN/dE = N0 × (E/Eref)−(α + βlog(E/Eref))) and a broken-power-law model dN/dE = N0 × (E/Ebreak)−Γ, where Γ = Γ1 for E < Ebreak and Γ = Γ2 otherwise, using 13 energy bins (spanning from 100 MeV to 500 GeV) and the model of the whole ROI. Finally, we tested the consistency of the results by studying the systematic uncertainties. The uncertainties mainly stem from the LAT effective area (Aeff) and the Galactic diffuse emission model. The systematic uncertainties regarding the LAT effective area are examined with the bracketing Aeff method2, and those regarding the diffuse Galactic model were estimated by artificially changing its normalization by ±6% with respect to the best-fit one (see, e.g., Ajello et al. 2011; Li et al. 2018).
The LAT source (i.e., 4FGL J0240.5+6113) is detected at very high significance (with  ) as point-like at the position RA = 40.143° ± 0.002° and Dec = 61.235° ± 0.002° (with only statistical errors). The spectral parameters of the best-fit log-parabola model correspond to N0 = (4.31 ± 0.04stat ± 0.12sys) × 10−11 MeV−1 cm−2 s−1, α = 2.40 ± 0.01stat ± 0.02sys, and β = 0.119 ± 0.004stat ± 0.006sys (referenced to an energy of 1.18 GeV). The best-fit parameters for a broken power law consist of N0 = (3.61 ± 0.73stat ± 0.99sys)×10−11 MeV−1 cm−2 s−1, Γ1 = 2.146 ± 0.009stat ± 0.075sys, Γ2 = 2.74 ± 0.04stat ± 0.07sys, and Ebreak = 1307 ± 117stat ± 304sys MeV (see both fitted models in Fig. 5). The test statistic seems to favor the log-parabola hypothesis over the broken-power-law one with
  . We note, however, that the two hypotheses are not nested and therefore the result of the likelihood ratio test cannot be trusted quantitatively. We searched for a possible extension of the source (with the fermipy extension method), but considering the source as extended does not result in better modeling of the data i.e., it does not significantly improve the likelihood with respect to the point-like case, with TSextended − TSpoint − like < 25 for both a 2D Gaussian source and a radial disk morphological model.
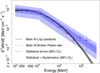 |
Fig. 5. Spectral energy distribution derived from Fermi-LAT for LS I +61 303 (in black dots, accounting for systematical errors) with the best-fit log-parabola (solid black line) and broken-power-law (dashed blue line) models. The dark and light shadowed regions correspond to the 1σ error of the best-fit models, i.e., with only statistical errors and accounting for systematical ones, respectively. |
3.2. Assessing the shortest gamma-ray time bin feasible for LS I +61 303
The best-fit broken-power-law model summarized above was then used to perform Fermi-LAT observation simulations regarding 4FGL J0240.5+6113 with different observation times, ranging from 1 to 72 h (in 16 steps). We performed the simulations with the Fermi tool GTOBSSIM, which allowed us to simulate (non-variable) point-like sources characterized by a specific spectral shape, either a power-law or broken-power-law spectrum. GTOBSSIM does not implement the log-parabola form, but the source’s spectrum exhibits a noticeable curvature (see Fig. 5). Hence, we chose the broken-power-law model. The simulated ROI was the same as the one for the LAT data analysis of 4FGL J0240.5+6113 (as described above). The observation simulations only account for the emission from the source of interest and for the Galactic and isotropic diffuse emission models. We also assumed that the flux from 4FGL J0240.5+6113 is steady during the simulated observation time. The simulations were next analyzed as real LAT data, following the same steps as performed before to find the best-fit position and spectral parameters of the LAT source. A simple linear fit of the source detection significance (approximated as  ) with respect to the observation time yields an average time for achieving the 5σ detection of 32.9 ± 4.7 h (the linear fit being a reduced chi-square of
  ).
).
The results from the simulations imply that under the assumptions explained above, the source would be detectable at a 5σ significance for intervals of ∼33 h. However, we would need larger time bins to properly derive the Fermi light curve of LS I +61 303. Otherwise, the detection of the source would not reach the 5σ significance in all (or most) of the time bins, firstly because of the presence of other gamma-ray sources in the ROI and secondly because the flux from LS I +61 303 is clearly not steady on timescales of days (we note the orbital modulation of the flux with a ∼26.5 day periodicity; Abdo et al. 2009). Hence, this result rules out the possibility of detecting the intra-orbit variability of LS I +61 303 in the LAT data on daily timescales regarding the orbital period studied in optical wavelengths, preventing us from searching the gamma-ray counterparts of the detected optical microflares. The lower panel of Fig. 1 shows the light curve of 4FGL J0240.5+6113 during the same orbital period as studied in the optical and with the binning derived from the performed simulations. We note that the average detection significance of the source among the different time bins was close to 5σ (i.e., ≈(4.5 ± 2.7)σ, as expected from the simulations).
4. Discussion and conclusions
A multiwavelength approach to the optical microflare phenomenon, during the TESS Sector 18 observations, can only currently be attempted in the gamma-ray domain using Fermi-LAT data as no other continuous and simultaneous monitoring is available. Hopefully, future coordinated observations will enable this approach in the radio or X-rays. Concurrent optical and gamma-ray microflares in LS I +61 303 would imply a common origin, most likely in shocks (Steinberg & Metzger 2018; Aydi et al. 2020). This expectation is inspired by semi-analytic models of nova shocks; these models show that most of the shocks’ kinetic energy that is dissipated while they move through a dense medium is radiated as thermal X-rays, which can be absorbed by neutral gas ahead or behind the shock and reemitted in optical frequencies (Metzger et al. 2014). Metzger et al. (2015) argue that a shock in which gamma-ray emission is radiated and observable (i.e., not absorbed) necessarily radiates the bulk of its dissipated thermal energy in the optical, while gamma-ray absorption at early times may introduce a delay in the gamma-ray emission. Hence, the optical emission we observed could be shock-powered, even if the gamma-ray emission is suppressed. In this context, the shock regions are naturally expected to form while a compact object magnetosphere interacts with the Be star circumstellar disk. Their size is expected to exceed the orbital dimensions and reach a few AU in the LS I +61 303 case (in agreement with the previous ∼17 AU upper limit.). Moreover, the decretion disk was well developed at the time of TESS observations, as the measured Hα equivalent width (given in Sect. 2.2) was closer to the maximum reported values (Zamanov et al. 2014). However, how the disk structure could relate to the apparent ∼1 d recurrence interval is not a straightforward issue and likely depends on the density pattern being sampled by the compact companion.
Based on the above nova-analogy scenario, we searched for the possible HE gamma-ray counterparts of the microflares in LAT data. Unfortunately, the possibility of detecting intra-orbit variability on daily timescales in LAT data is ruled out through simulations given the too low flux level of the source. Nevertheless, its expected value can be crudely estimated as follows. According to Metzger et al. (2015), in the shock-powered scenario for optical microflares, we could expect gamma-ray counterparts with luminosity Lγ ≲ ϵγϵnthLopt. Here, Lopt is the optical luminosity of the flares, ϵnth is the fraction of the total power dissipated by shocks that goes into accelerating nonthermal ions or electrons, and ϵγ includes the radiative efficiency in the accelerated particles and the total gamma-ray emission radiated in the LAT bandpass. On the one hand, the optical luminosity of the observed microflares results in Lopt ∼ 2.1 × 1034 erg s−1 for fluctuations of ∼0.02 mag over an average magnitude for LS I +61 303 of 9.55 in the I band (Reig & Fabregat 2015, approximately centered in the same wavelength as the TESS observations), and a distance of 2.63 kpc (Gaia EDR3; Gaia Collaboration 2021). On the other hand, the next upper limit, ϵγϵnth ≲ 0.03, holds according to nonrelativistic shock simulations (both for hadronic and leptonic models, again following Metzger et al. 2015). This implies a gamma-ray luminosity for the flares of Lγ ∼ 6.3 × 1032 erg s−1, or a photon flux at 2.63 kpc on the order of 7.6 × 10⁻¹³ erg cm−2 s−1 (taking an average photon energy in the LAT passband of Ebreak = 1307 MeV). The predicted photon flux is thus far below (by about three orders of magnitudes) the sensitivity achieved in the LAT gamma-ray light curve of LS I +61 303 (in bins of 33 h; see the lower panel of Fig. 1). Although we believe that the shock-driven scenario is feasible, it remains hard to prove observationally.
Other alternative scenarios are worth considering. In particular, one could speculate that the observed low-amplitude variability is of rotation or pulsation origin. Classical Be stars are physically understood as rapidly rotating B stars. However, in this case, the reported optical variability can hardly be related to a strictly periodic rotation or pulsation because no clearly constant period is apparent in the data wavelet analysis or other periodograms. Finally, if LS I +61 303 hosts a black hole surrounded by an accretion disk, as proposed by Massi et al. (2017), the reported light curve could be understood in terms of flickering. Nevertheless, this type of variability in active binaries is usually observed on shorter timescales (of around an hour), and the black hole assumption appears to have recently been ruled out.
To conclude, mini-flares in LS I +61 303 are newly observed phenomena, our understanding of which remains challenging as we await future data and theoretical work.
Acknowledgments
EM acknowledges support by grant P18-FR-1580 from the Consejería de Economía y Conocimiento de la Junta de Andalucía under the Programa Operativo FEDER 2014–2020. ESA, PLLE and JM acknowledge support by grant PID2019-105510GB-C32/AEI/10.13039/501100011033 from State Agency for Research of the Spanish Ministry of Science and Innovation entitled High energy sources with outflows at different scales: observation of galactic sources. We also acknowledge support by Consejería de Economía, Innovación, Ciencia y Empleo of Junta de Andalucía as research group FQM- 322, as well as FEDER funds. JMP, DdS and JN acknowledge financial support from the State Agency for Research of the Spanish Ministry of Science and Innovation under grant PID2019-105510GB-C31 and through the Unit of Excellence María de Maeztu 2020-2023 award to the Institute of Cosmos Sciences (CEX2019-000918-M). This paper includes data collected with the TESS mission, obtained from the MAST data archive at the Space Telescope Science Institute (STScI). Funding for the TESS mission is provided by the NASA Explorer Program. STScI is operated by the Association of Universities for Research in Astronomy, Inc., under NASA contract NAS 5-26555.
References
- Abdo, A. A., Ackermann, M., Ajello, M., et al. 2009, ApJ, 701, L123 [NASA ADS] [CrossRef] [Google Scholar]
- Abdollahi, S., Acero, F., Ackermann, M., et al. 2020, ApJS, 247, 33 [Google Scholar]
- Acciari, V. A., Beilicke, M., Blaylock, G., et al. 2008, ApJ, 679, 1427 [NASA ADS] [CrossRef] [Google Scholar]
- Ajello, M., Allafort, A., Baldini, L., et al. 2011, ApJ, 744, 80 [Google Scholar]
- Albert, J., Aliu, E., Anderhub, H., et al. 2006, Science, 312, 1771 [NASA ADS] [CrossRef] [Google Scholar]
- Albert, J., Aliu, E., Anderhub, H., et al. 2009, ApJ, 693, 303 [NASA ADS] [CrossRef] [Google Scholar]
- Aleksić, J., Alvarez, E. A., Antonelli, L. A., et al. 2012, ApJ, 746, 80 [CrossRef] [Google Scholar]
- Atwood, W., Albert, A., Baldini, L., et al. 2013, Pass 8: Toward the Full Realization of the Fermi-LAT Scientific Potential, 4th Fermi Symposium Proc., C121028 [Google Scholar]
- Aydi, E., Sokolovsky, K. V., Chomiuk, L., et al. 2020, Nat. Astron., 4, 776 [CrossRef] [Google Scholar]
- Bednarek, W. 2006a, MNRAS, 371, 1737 [NASA ADS] [CrossRef] [Google Scholar]
- Bednarek, W. 2006b, MNRAS, 368, 579 [NASA ADS] [CrossRef] [Google Scholar]
- Bignami, G. F., Caraveo, P. A., Lamb, R. C., Markert, T. H., & Paul, J. A. 1981, ApJ, 247, L85 [NASA ADS] [CrossRef] [Google Scholar]
- Bosch-Ramon, V., Paredes, J. M., Romero, G. E., & Ribó, M. 2006, A&A, 459, L25 [NASA ADS] [CrossRef] [EDP Sciences] [Google Scholar]
- Bruel, P., Burnett, T. H., Digel, S. W., et al. 2018, Fermi-LAT Improved Pass 8 Event Selection, 8th Fermi Symposium Proc. [Google Scholar]
- Burrus, C. S., Gopinath, R., & Guo, H. 1998, Introduction to Wavelets and Wavelet Transforms (New Jersey: Prentice-Hall) [Google Scholar]
- Casares, J., Ribas, I., Paredes, J. M., Martí, J., & Allende Prieto, C. 2005, MNRAS, 360, 1105 [NASA ADS] [CrossRef] [Google Scholar]
- Chernyakova, M., Neronov, A., & Walter, R. 2006, MNRAS, 372, 1585 [CrossRef] [Google Scholar]
- Deming, D., Knutson, H., Kammer, J., et al. 2015, ApJ, 805, 132 [Google Scholar]
- Dermer, C. D., & Böttcher, M. 2006, ApJ, 643, 1081 [NASA ADS] [CrossRef] [Google Scholar]
- Dubus, G. 2006, A&A, 456, 801 [NASA ADS] [CrossRef] [EDP Sciences] [Google Scholar]
- Esposito, P., Caraveo, P. A., Pellizzoni, A., et al. 2007, A&A, 474, 575 [NASA ADS] [CrossRef] [EDP Sciences] [Google Scholar]
- Frail, D. A., & Hjellming, R. M. 1991, AJ, 101, 2126 [NASA ADS] [CrossRef] [Google Scholar]
- Gaia Collaboration (Brown, A. G. A., et al.) 2021, A&A, 649, A1 [NASA ADS] [CrossRef] [EDP Sciences] [Google Scholar]
- Goldoni, P., & Mereghetti, S. 1995, A&A, 299, 751 [NASA ADS] [Google Scholar]
- Gregory, P. C. 2002, ApJ, 575, 427 [NASA ADS] [CrossRef] [Google Scholar]
- Gregory, P. C., & Taylor, A. R. 1978, Nature, 272, 704 [NASA ADS] [CrossRef] [Google Scholar]
- Grundstrom, E. D., Caballero-Nieves, S. M., Gies, D. R., et al. 2007, ApJ, 656, 437 [NASA ADS] [CrossRef] [Google Scholar]
- Gupta, S., & Boettcher, M. 2006, ApJ, 650, L123 [NASA ADS] [CrossRef] [Google Scholar]
- Hadasch, D., Torres, D. F., Tanaka, T., et al. 2012, ApJ, 749, 54 [Google Scholar]
- Harrison, F. A., Ray, P. S., Leahy, D. A., Waltman, E. B., & Pooley, G. G. 2000, ApJ, 528, 454 [NASA ADS] [CrossRef] [Google Scholar]
- Hutchings, J. B., & Crampton, D. 1981, PASP, 93, 486 [NASA ADS] [CrossRef] [Google Scholar]
- Leahy, D. A., Harrison, F. A., & Yoshida, A. 1997, ApJ, 475, 823 [NASA ADS] [CrossRef] [Google Scholar]
- Li, J., Torres, D. F., Zhang, S., et al. 2011, ApJ, 733, 89 [NASA ADS] [CrossRef] [Google Scholar]
- Li, J., Torres, D. F., Zhang, S., et al. 2012, ApJ, 744, L13 [NASA ADS] [CrossRef] [Google Scholar]
- Li, J., Torres, D. F., Lin, T. T., et al. 2018, ApJ, 858, 84 [NASA ADS] [CrossRef] [Google Scholar]
- Lightkurve Collaboration (Cardoso, J. V. D. M., et al.) 2018, Astrophysics Source Code Library [record ascl:1812.013] [Google Scholar]
- Maraschi, L., & Treves, A. 1981, MNRAS, 194, 1P [Google Scholar]
- Martí, J., & Paredes, J. M. 1995, A&A, 298, 151 [Google Scholar]
- Martí, J., Luque-Escamilla, P. L., & García-Hernández, M. T. 2017, Bulgarian Astron. J., 26, 91 [Google Scholar]
- Massi, M., Ribó, M., Paredes, J. M., Peracaula, M., & Estalella, R. 2001, A&A, 376, 217 [NASA ADS] [CrossRef] [EDP Sciences] [Google Scholar]
- Massi, M., Ribó, M., Paredes, J. M., et al. 2004, A&A, 414, L1 [NASA ADS] [CrossRef] [EDP Sciences] [Google Scholar]
- Massi, M., Migliari, S., & Chernyakova, M. 2017, MNRAS, 468, 3689 [Google Scholar]
- Mattox, J. R., Bertsch, D. L., Chiang, J., et al. 1996, ApJ, 461, 396 [Google Scholar]
- Mendelson, H., & Mazeh, T. 1989, MNRAS, 239, 733 [NASA ADS] [Google Scholar]
- Metzger, B. D., Hascoët, R., Vurm, I., et al. 2014, MNRAS, 442, 713 [NASA ADS] [CrossRef] [Google Scholar]
- Metzger, B. D., Finzell, T., Vurm, I., et al. 2015, MNRAS, 450, 2739 [Google Scholar]
- Paredes, J. M. 1987, Ph.D. Thesis, University of Barcelona, Spain [Google Scholar]
- Paredes, J. M., & Figueras, F. 1986, A&A, 154, L30 [NASA ADS] [Google Scholar]
- Paredes, J. M., Marti, J., Peracaula, M., & Ribo, M. 1997, A&A, 320, L25 [NASA ADS] [Google Scholar]
- Paredes, J. M., Ribó, M., Bosch-Ramon, V., et al. 2007, ApJ, 664, L39 [NASA ADS] [CrossRef] [Google Scholar]
- Peracaula, M., Marti, J., & Paredes, J. M. 1997, A&A, 328, 283 [NASA ADS] [Google Scholar]
- Reig, P., & Fabregat, J. 2015, A&A, 574, A33 [NASA ADS] [CrossRef] [EDP Sciences] [Google Scholar]
- Romero, G. E., Christiansen, H. R., & Orellana, M. 2005, ApJ, 632, 1093 [NASA ADS] [CrossRef] [Google Scholar]
- Romero, G. E., Okazaki, A. T., Orellana, M., & Owocki, S. P. 2007, A&A, 474, 15 [NASA ADS] [CrossRef] [EDP Sciences] [Google Scholar]
- Sidoli, L., Pellizzoni, A., Vercellone, S., et al. 2006, A&A, 459, 901 [NASA ADS] [CrossRef] [EDP Sciences] [Google Scholar]
- Steinberg, E., & Metzger, B. D. 2018, MNRAS, 479, 687 [NASA ADS] [Google Scholar]
- Taylor, A. R., & Gregory, P. C. 1982, ApJ, 255, 210 [NASA ADS] [CrossRef] [Google Scholar]
- Taylor, A. R., Young, G., Peracaula, M., Kenny, H. T., & Gregory, P. C. 1996, A&A, 305, 817 [NASA ADS] [Google Scholar]
- Torres, D. F., & Halzen, F. 2007, Astropart. Phys., 27, 500 [NASA ADS] [CrossRef] [Google Scholar]
- Torres, D. F., Rea, N., Esposito, P., et al. 2012, ApJ, 744, 106 [NASA ADS] [CrossRef] [Google Scholar]
- Waters, L. B. F. M., van den Heuvel, E. P. J., Taylor, A. R., Habets, G. M. H. J., & Persi, P. 1988, A&A, 198, 200 [NASA ADS] [Google Scholar]
- Weng, S. S., Qian, L., Wang, B. J., et al. 2022, Nat. Astron., in press https://doi.org/10.1038/s41550-022-01630-1 [Google Scholar]
- Wood, M., Caputo, R., Charles, E., et al. 2017, Int. Cosmic Ray Conf., 301, 824 [Google Scholar]
- Zamanov, R., Martí, J., Stoyanov, K., Borissova, A., & Tomov, N. A. 2014, A&A, 561, L2 [NASA ADS] [CrossRef] [EDP Sciences] [Google Scholar]
- Zdziarski, A. A., Neronov, A., & Chernyakova, M. 2010, MNRAS, 403, 1873 [Google Scholar]
All Figures
|
Fig. 1. Simultaneous optical and gamma-ray light curves. Top panel: TESS light curve of LS I +61 303 in November 2019 with a binning time of half an hour. The vertical lines represent the dates when optical spectroscopy was obtained. The black shaded area comprises the periastron phase, which has been located within the interval [0.23–0.3]. The top horizontal axis gives the orbital phase of the data computed using the 26.496 d orbital period and phase origin on Julian date 2443366.775. The vertical axis is plotted in terms of relative magnitude, computed as −2.5log(TESS count rate) plus an arbitrary zero point, for easier comparison with historical photometric studies that use magnitudes instead of flux. Bottom panel: in blue points, the Fermi-LAT photon flux of 4FGL J0240.5+6113 computed in bins of 32.9 h in the same orbital period as the optical data (with only statistical errors). The black dots stand for the source detection significance ( |
| In the text | |
|
Fig. 2. Wavelet analysis of the LS I +61 303 light curve. The vertical shaded region represents the estimated periastron passage region. |
| In the text | |
|
Fig. 3. Zoomed-in view of a sector of the TESS light curve, showing the shortest timescales of variability. Error bars are smaller than 1 millimagnitude. |
| In the text | |
|
Fig. 4. Optical spectra of LS I +61 303 contemporaneous to the TESS monitoring. |
| In the text | |
|
Fig. 5. Spectral energy distribution derived from Fermi-LAT for LS I +61 303 (in black dots, accounting for systematical errors) with the best-fit log-parabola (solid black line) and broken-power-law (dashed blue line) models. The dark and light shadowed regions correspond to the 1σ error of the best-fit models, i.e., with only statistical errors and accounting for systematical ones, respectively. |
| In the text | |
Current usage metrics show cumulative count of Article Views (full-text article views including HTML views, PDF and ePub downloads, according to the available data) and Abstracts Views on Vision4Press platform.
Data correspond to usage on the plateform after 2015. The current usage metrics is available 48-96 hours after online publication and is updated daily on week days.
Initial download of the metrics may take a while.