Fig. 1.
Download original image
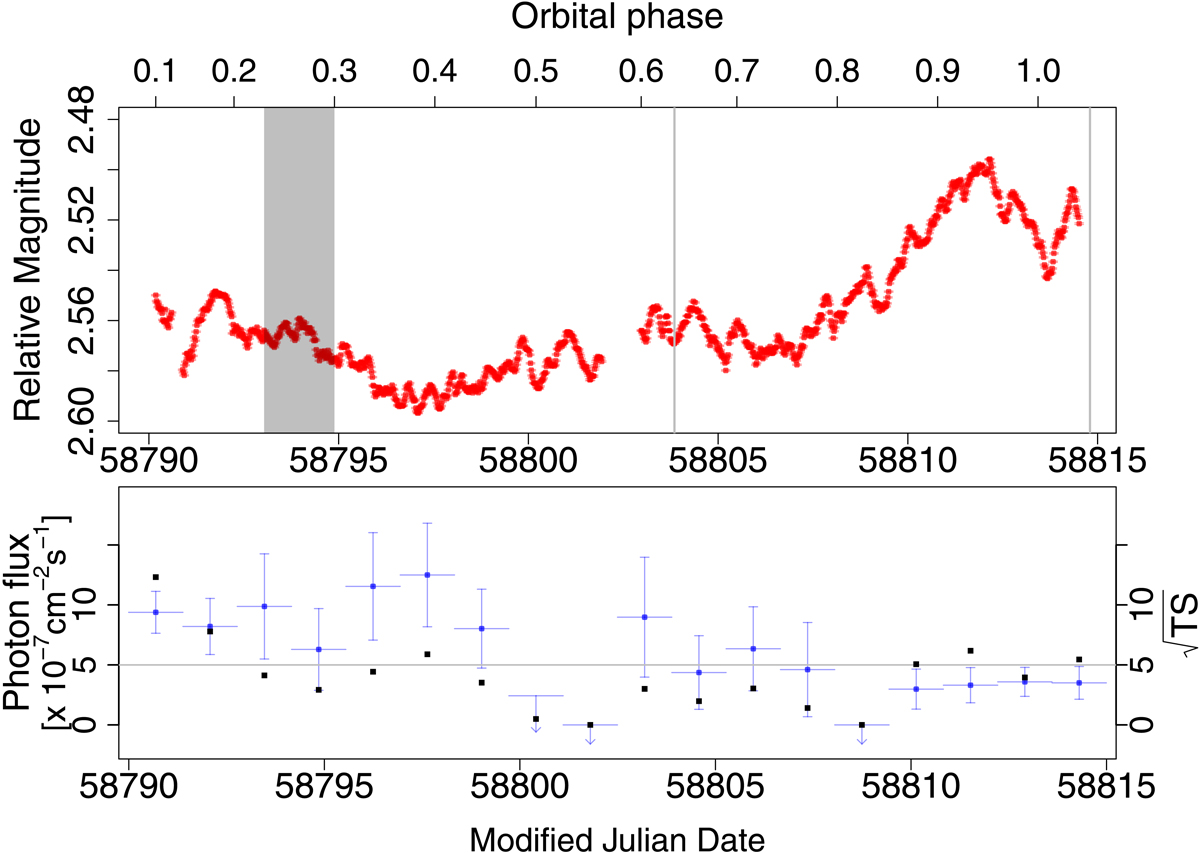
Simultaneous optical and gamma-ray light curves. Top panel: TESS light curve of LS I +61 303 in November 2019 with a binning time of half an hour. The vertical lines represent the dates when optical spectroscopy was obtained. The black shaded area comprises the periastron phase, which has been located within the interval [0.23–0.3]. The top horizontal axis gives the orbital phase of the data computed using the 26.496 d orbital period and phase origin on Julian date 2443366.775. The vertical axis is plotted in terms of relative magnitude, computed as −2.5log(TESS count rate) plus an arbitrary zero point, for easier comparison with historical photometric studies that use magnitudes instead of flux. Bottom panel: in blue points, the Fermi-LAT photon flux of 4FGL J0240.5+6113 computed in bins of 32.9 h in the same orbital period as the optical data (with only statistical errors). The black dots stand for the source detection significance (![]() ) in each time bin. The black horizontal line marks the 5σ detection significance.
) in each time bin. The black horizontal line marks the 5σ detection significance.
Current usage metrics show cumulative count of Article Views (full-text article views including HTML views, PDF and ePub downloads, according to the available data) and Abstracts Views on Vision4Press platform.
Data correspond to usage on the plateform after 2015. The current usage metrics is available 48-96 hours after online publication and is updated daily on week days.
Initial download of the metrics may take a while.