| Issue |
A&A
Volume 650, June 2021
|
|
|---|---|---|
| Article Number | A171 | |
| Number of page(s) | 13 | |
| Section | Interstellar and circumstellar matter | |
| DOI | https://doi.org/10.1051/0004-6361/202039372 | |
| Published online | 24 June 2021 | |
The peculiar nebula Simeis 57
II. Distance, nature and excitation
1
Sterrewacht Leiden,
PO Box 9513,
2300
RA Leiden,
The Netherlands
e-mail: This email address is being protected from spambots. You need JavaScript enabled to view it.
2
Instituto de Astrofísica e Ciências do Espaço, Universidade do Porto, CAUP,
Rua das Estrellas,
4150-762
Porto,
Portugal
3
Presently: Pels Rijcken,
PO Box 11756,
2502
AT Den Haag,
The Netherlands
4 Center for Astrophysics and Space Astronomy (CASA), University of Colorado,
389 UCB,
Boulder,
CO
808309,
USA
5
NASA/GSFC,
Mail Code: 667,
Greenbelt,
MD
20771,
USA
Received:
8
September
2020
Accepted:
21
April
2021
Abstract
Simeis 57 (HS 191) is an optically bright nebula in the Cygnus X region with a peculiar appearance that suggests an outflow from a rotating source. Newly obtained observations and archival data reveal Simeis 57 as a low-density (ne ~ 100 cm−3) nebula with an east-to-west excitation gradient. The extinction of the nebula is AV ≤ 2 mag. The nebula is recognizable but not prominent in mid- and far-infrared images. In its direction, half a dozen small CO clouds have been identified at VLSR = +5 km s−1. One of these coincides with both the optical nebula and a second CO cloud at the nebular velocity VLSR ≈−10 km−1. No luminous stars are embedded in these molecular clouds, nor are any obscured by them and no sufficiently luminous stars are found in the immediate vicinity of the nebula. Instead, all available data points to the evolved star HD 193793 = WR 140 (an O4-5 supergiant and WC7 Wolf–Rayet binary) as the source of excitation, notwithstanding its large separation of 50′, about 25 pc at the stellar distance of 1.7 kpc. Simeis 57 appears to be a part of a larger structure surrounding the HI void centered on HD 193793.
Key words: ISM: structure / HII regions / ISM: individual objects: Simeis 57
© ESO 2021
1 Introduction
The Galactic nebula Simeis 57, also known as HS 191 (Gaze & Shajn 1951, 1955) is a very bright emission nebula of peculiar shape in the constellation of Cygnus (cf. Parker et al. 1979). Often referred to as the Propeller Nebula, this nebula is a popular object for amateur astrophotographers. Its major features are two curved nebulosities (DWB 111 and DWB 119, Dickel et al. 1969). The center of this nebula is cut by a long dust filament that continues adjacent to the nebular patch DWB 118. Other nearby nebulae are DWB 126 to the north and DWB 108 and DWB 107 to the south; the latter has the appearance of a bright rim. At a Galactic longitude of 80.3°, Simeis 57 is inside the solar circle but its actual distance is unknown. In this direction, the Galactic line of sight is tangential to the Orion-Cygnus spiral arm and several kiloparsecs long. The relatively high Galactic latitude of + 4.7° and the large angular extent (~20′) suggest, however, that it is not very distant.
Simeis 57 is located near the edge of a large (18° × 13°) X-ray structure known as the Cygnus superbubble (Cash et al. 1980) but none of the large-scale X-ray or radio continuum maps presented by Uyan"i"ker et al. (2001) show anything remarkable concerning its position. Simeis 57 is far away from the nearest OB associations (Cyg OB2 and Cyg OB8 at heliocentric distances of 1.4 kpc and 1.9 kpc, cf. Rygl et al. 2012; Mahy et al. 2015).
In an earlier paper, Israel et al. (2003) presented high-resolution radio continuum maps from which they concluded that the radio emission of Simeis 57 is free-free thermal emission originating in a gas of moderate electron densities with S and N2 spectra that extend a modest foreground extinction. All of this points to excitation by a star that is sufficiently bright to be easily identified, but the lack of an obvious candidate meant that the nature of Simeis 57 was left a mystery.
In this work, we investigate the ionized gas, dust, and stars in the field of Simeis 57 in a further attempt to identify its nature and the source of its excitation. Fig. 1 shows part of the Isaac Newton Telescope Photometric H-Alpha Survey (IPHAS, Drew et al. 2005) combined with the new Hα data described below. Simeis 57 stands out in brightness and shape among the filaments at the outskirts of the Cygnus-X region. Fig. 2 shows the division of the nebula into subregions A, B, C, and D (cf. Israel et al. 2003) with respective surface areas of 45, 30, 10, and 15 arcmin2 within the lowest contour. Regions A (DWB 111) and B (DWB 119) form the S-shaped nebula, region C is a spur that extends northward from region B, and region D (DWB 118) is a separate filament to the southeast.
2 Observations
2.1 Long-slit spectra
We extracted archival spectra taken on July 22, 1990 and May 6, 2007 and obtained new spectra on May 22–24, 2017 (Fig. 3, Table 1) with the Intermediate Dispersion Spectrograph (IDS) on the Isaac Newton Telescope (INT). The INT is a 2.54 m telescope located at the Observatorio del Roque de los Muchachos on the island of La Palma (Spain). The IDS is a long-slit spectrograph located at the Cassegrain focus that has a full slit-length of 3.3′ and a spatial scale of 0.4″ pix−1. The 2007 and 2017 spectroscopy used the R300V, R400V, and R600R gratings, which have spectral resolutions of 1.87Å pix−1, 1.41Å pix−1, and 0.94Å pix−1, respectively,and a wavelength coverage correspondingly decreasing. The 1990 spectroscopy used Grating 10, which has a spectral resolution of 1.03Å pix−1. The positions are shown in Fig. 2. We note that the northernmost spectrum (N2) is right at the edge of DWB 111.
The wavelength solutions were derived from arc lamp spectra and cosmic rays were removed with the L.A. Cosmic package by van Dokkum et al. (2012). For the flux calibration of the spectra obtained in 2017 we used the standard star SP1550+330. The R300V grating spectrum was calibrated with the standard star Kopff27. The spectra were spatially integrated over the aperture, excluding the outer 25 pixels on either side. The two spectra taken at the southern position (S) were concatenated to yield a single spectrum.
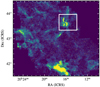 |
Fig. 1 Mosaic of Hα line emissionin the 3° × 3° region surrounding Simeis 57, centered on α = 20h17m50.4s, δ = + 43°01′48”. The white box indicates the region studied in this paper, which is enlarged in Fig. 2. |
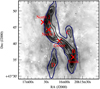 |
Fig. 2 Hα line emission map of Simeis 57 with the subregions A, B, C, and D. The black contours correspond to DRAO 1420 MHz radio continuum flux densities of 20, 25, and 30 mJy arcmin−2. The red crosses denote the central positions of the IDS long-slit spectra from Table 1 and Fig. 3. |
Observing log of the INT-IDS spectroscopy.
2.2 WFC Images
In 2016 April and 2017 April, we obtained several images of Simeis 57 (Fig. 4) with the Wide-Field Camera (WFC) at the prime focus of the INT. With four CCDs that have 2048 × 4096 pixels each, the WFC is a mosaic camera with a CCD pixel scale of 0.33″ and a field of view of 34.2′ × 34.2′. Inter-chip gaps are about 1′ in size.
For theline emission we used the standard INT narrowband filters (Hα, FWHM 95 Å; [SII](6716+6730), 80 Å; Hβ 30 Å; [OIII]5007, 100 Å) and for the continuum from stars and sky the broadband filters (R, FWHM 1347 Å, G, FWHM 1285 Å). We made multiple exposures in each filter. Total exposure times varied from 850 s for R to 6400 s for [OIII]5007. Most lines were exposed for about 3000 s. While taking the [SII] and [OIII] images in 2017, we applied a random dither of a few arcmin to fill the inter-chip gaps. No dithering was applied to the 2016 Hα and Hβ images. We eliminated the inter-chip gaps in the Hα image by combining our own five Hα images with multiple exposures from the IPHAS Hα survey (Drew et al. 2005). The average seeing of our observations is 1.7″, with the exception of Hβ (2.3″) and Hα (1.3″).
The individual exposures were debiased, flat-fielded, and combined using THELI (Schirmer 2013; Erben et al. 2005). The observations were made during bright moon and suffered from significant sky brightness. We estimated sky levels by taking the median of selected regions outside the nebula after masking objects using SExtractor (Bertin & Arnouts 1996). We computed astrometric solutions using SCAMP (Bertin 2006) with the Gaia DR2 catalog (see Sect. 2.4). The astrometry should be better than 0.5″.
No spectrophotometric calibration stars were recorded during the observations. Instead, Hα and r images are directly calibrated with the INT/WFC Photometric Hα survey of the Northern Milky Way (IPHAS DR2, Drew et al. 2005) release, which was made with the same instrument. This dataset has i, r, and Hα magnitudes for nearly 5000 objects in our field of view. Using SExtractor, we extracted magnitudes of all sources with S∕N ≥ 7. We used aperture photometry with the same diameter as the IPHAS database (2.3″, or 7 pixels). Local background subtraction was done with a rectangular mesh of 16 pixels around the star. The magnitude zero-points have errors less than 0.15 mag in r and Hα.
No calibrators nor reference catalogs are available for the continuum-subtracted [SII], [OIII] and Hβ images. Instead, we calibrated the relative fluxes of the images with the absolute fluxes from the spectra in Fig. 3 at the four position sampled. For Hα, the two methods agree within20%.
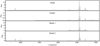 |
Fig. 3 Spatially integrated long slit spectra at the positions indicated in Fig. 2. Fluxes are in units of 10−16 erg cm−2 s−1 Å−1. |
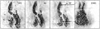 |
Fig. 4 Continuum-subtracted line images of Simeis 57 in identical fields of view. From left to right: [SII](6716+6730), Hα+[NII], Hβ, and [OIII]5007. In these images, the first contour corresponds to Iλ = (5.6, 18, 5, 1.4) × 10−17 erg s−1 cm−2 arcsec−2, respectively. Subsequent contours increase by factors of 1.5. The contours in the Hα +[NII] map represent the pure Hα flux. The Hβ image was not dithered and suffers from camera artifacts and gaps between the CCDs. |
2.3 UV data: Swift and GALEX
We obtained a new UV image of the Simeis 57 field with the NASA Neil Gehrels Swift Observatory, a multiwavelength space observatory launched in 2004. The onboard Ultraviolet/Optical Telescope (UVOT) is a modified Ritchey-Chrétien telescope with an aperture of 30 cm and an f∕2.0 primary reimaged to f∕13. Its 2048 × 2048 pixel detection array combines a pixel scale of 0.5″ with a 17′ × 17′ field of view (Poole et al. 2008). The observations were made between 2012 March and 2013 January in the UVW2 filter, which has a maximum efficiency at λcenter = 2000 Å. At this wavelength, the resolution is about 1.5″.
We also retrieved near-UV (λeff = 2310 Å) observationsof the region surrounding DWB 111 from the archive of the NASA GALEX space observatory (2003–2012). The GALEX observatory is equipped with a 50 cm aperture telescope with a field of view of 1.2 degrees wide. We used MOSAIX (Armengot et al. 2014) to stack the retrieved images. In Fig. 5 we show both UV images.
2.4 Optical data: Gaia
Gaia (Gaia Collaboration 2018) is an European Space Agency (ESA) space observatory that was launched in 2013. It uses two telescopes to perform astrometry, photometry, and spectrometry of stars with very high precision down to a visual magnitude of 20. In the absence of visual extinction, it should thus see OB stars across the entire Galaxy. It was designed to provide position, parallax, and annual proper motion with accuracies of 0.025 mas at V = 15 mag to 0.6 mas at V = 20 mag, and distances accurate to ≤1%, and ≤10%, respectively.
From the second data release (DR2) in 2018, we extracted 218 136 stars within a radius of one degree from the nebula and selected the 13 381 stars (6%) with high-quality data (RUWE < 1.40) shown in Fig. 91. Because stars associated with the ionization of Simeis 57 should be hot, we specifically considered the 49 bright, blue stars with MG < 3 and GBP − GRP < 0.4. This sample defines the peak of the main-sequence region in the Hertzsprung-Russell (HR) diagram of the Simeis 57 region. Many of these stars are visible in the NASA GALEX and ESO Digitized Sky Survey (DSS2) data, and this includes a few close to the propeller nebula itself.
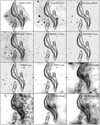 |
Fig. 5 UV, optical, and infrared images of Simeis 57. Each image shows the same region of 0.4 × 0.4 deg centered on α = 304.04, δ = 43.69. The UV images comprise SWIFT UVOT (λeff = 1928 Å) and GALEXnear-UV (λeff = 2310 Å) exposures. Optical broadband images include those from our INT WFC observations with the filters sloan g (λ0 = 4846 Å) and sloan r (λ0 = 6240 Å). Near-infrared images are 2MASS J and Ks band at wavelengths of 1.25 μm and 2.2 μm and WISE band 2 to 4 images at wavelengths of 4.6, 12, and 22 μm. Far-infrared images are AKARI 65, enhanced IRAS 100, and AKARI 160 μm. The point source IRAS 20145+4333 is denoted by a red cross in the HIRES 100 μm map. Contours correspond to DRAO 1420MHz radio continuum intensities of 20, 25, 30 mJy arcmin−2. |
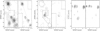 |
Fig. 6 Undersampled J = 1–0 12CO (left panels) and 13CO (right panels) maps of molecular clouds in the field of Simeis 57, whose center is denoted by a cross. The emission at +5 km s−1 is shown in the leftmost two panels (averaged over a 5 km s−1 velocity interval), and the central two panels show the emission at −10 km s−1 (averaged over a 4 km s−1 interval). In the 12CO panels, the regions with improved sampling are indicated by a solid-line boundary. The rightmost two panels show the position–velocity map along the dashed line in the 13CO map. Position offsets are relative to α = 20h16m16.7s, δ = + 43°47′54″ (J = 2000). |
2.5 Infrared data: IRAS, 2MASS, WISE, and Akari
We used the public databases kept at the NASA/IPAC Infrared Science Archive (IRSA) to investigate the infrared properties of Simeis 57 and surroundings. Far-infrared maps were constructed from the IRAS and the Akari data, near- and mid-infrared maps from the WISE data, and near-infrared maps from the 2MASS data.
We used enhanced resolution IRAS (Neugebauer et al. 1984) infrared continuum maps at 12, 25, 60, and 100 μm from the Infrared Processing and Analysis Center (IPAC). The HIRES enhancements employs the maximum correlation method (MCM; Aumann et al. 1990) in 20 iterations to construct resolution-enhanced coadded IRAS images. The original IRAS resolutions vary between 0.5′ at 12 μm to about 2′ at 100 μm. The HIRES enhancements provided a roughly five-fold increase in resolution, but the actual resolution varies over the map. A tilted plane was fitted to the background and subtracted. The IRAS map in Fig. 5 is dominated by diffuse extended emission from warm dust.
Between 1997 and 2001, the University of Massachusetts carried out an all-sky survey in the J 1.25μm, H 1.65 μm, and Ks 2.17 μm bands (Skrutskie et al. 2006). The resulting digital 2MASS sky atlas has a resolution of 4″ in each of the three bands. In Fig. 5 we show the J and KS band imagescentered on Simeis 57. These images do not show emission from either nebula or dust but are dominated by the stars in the field.
We downloaded NASA Wide-Field Infrared Survey Explorer (WISE, 2009–2011) archival images with a field of view of 47′ and a resolution of 6″ in four bands at 3.4, 4.6, 12, and 22 μm. The last two have a much higher sensitivity than the corresponding IRAS bands. In Fig. 5, the near-infrared (4.6 μm) image is dominated by the stars in the field, but the two mid-infrared (12 μm and 22 μm) images showemission from hot dust associated with the nebula. Unlike the IRAS images, these very sensitive WISE images still show the brightest stars.
The Akari infrared observatory, developed by the Japan Aerospace Exploration Agency (JAXA) with ESA participation, conducted an all-sky survey (2006–2007) in four F bands at 65, 90, 140, and 160 μm. This instrument has a resolution of 1′ to 1.5′ (Doi et al. 2015) comparable to that of HIRES, with the advantage of being constant across the field. The data were released in 2014 as 6° × 6° FITS images covering the whole sky. Like the IRAS images, the Akari images at 65 and 160 μm in Fig. 5 are dominated by the diffuse thermal emission from warm dust.
2.6 Millimeterwave CO data: BTL, NRAO, and JCMT
Dense clouds of dust and gas can hide luminous stars from view and Simeis 57 may be associated with a potentially much larger molecular cloud complex not seen at optical or infrared wavelengths. We used the Bell Telephone Laboratories (BTL) 7 m telescope in New Jersey in 1983 to observe the J = 1–0 12CO (115 GHz) and the 13CO (110 GHz) transitions in frequency-switched mode with a clean Gaussian beam of 100″. The observing and reduction techniques were identical to those described by Bally et al. (1987). The undersampled 40′ × 64′ maps reveal five small clouds with VLSR ~ +5 km s−1. In four of these clouds, we increased the map sampling to a 2.5′ grid. At the map center, a fifth cloud occurs at a separate velocity VLSR = –10 km s−1 (Fig. 6). Additional 12CO and 13CO observations, made in 1989 with the NRAO 12 m telescope, yielded higher-resolution (55″) 12CO/13CO isotopolog ratios at various positions in the central cloud. Finally, the central cloud was mapped in the J = 2–1 transition with the James Clerk Maxwell Telescope (JCMT) in various observing runs between 2002 and 2005 at an even higher resolution of 22″. The fully sampled (5″–10″ grid) 13CO map covers an area 420″ × 560″ (Fig. 7). In 12CO two smaller maps were obtained centered on offsets (0, +200″) and (−80″, −30″), respectively.
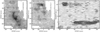 |
Fig. 7 Fully sampled J = 2–113CO maps in the field centered on Simeis 57 (offset relative to α = 20h16m08.2s, δ = 43°41′02.4″) smoothed to a resolution of 30″. At left is the emission at +5 km s−1 (averaged over a 6 km s−1 velocity interval), in the center the emission at −10 km s−1 (averaged over a 10 km s−1 interval), and at right the position–velocity distribution. |
3 Analysis
3.1 Distance
Israel et al. (2003) suggested that Simeis 57 is relatively nearby and found the extinction in front of the nebula to vary between AV = 1.0m and AV = 2.8m with a mean of 2m. Recent work based on Gaia, Pan-STARRS 1, and 2MASS by Green et al. (2019) provides more detail on the reddening E(g − r)2 of field stars in the direction of Simeis 57 as a function of distance. In Fig. 8, steep increases in reddening indicate the presence of dust sheets at m − M = 10.5m) and m − M = 12m, in which extinction jumps from AV = 1.0m to 2.4m at 1.3 ± 0.1 kpc and from AV = 2.5m to 3.6m at 2.5 ± 0.2 kpc; this suggests that Simeis 57 is located between these distances.
The distribution of extinction and parallaxes of the Gaia sample stars is shown in Fig. 9, in which colored dots denote the bright blue stars mentioned earlier. The parallax distribution has a sharp edge at about 0.35 milli-arcsec. This corresponds to a distance of about 3 kpc and a height above the plane of 250 pc. At that point the line of sight clears the Milky Way disk so that 3 kpc is the upper limit to the distance of Simeis 57. The subset of bright blue stars samples a relatively large range of distances between 350 pc and 1500 pc, but it is not evident that these stars are associated with each other or that Simeis 57 is related to any of them. Although the evidence is still inconclusive, we adopt a distance of D = 1.7 ± 0.5 kpc, which we substantiate in more detail in Sect. 3.6.
3.2 The nature of the nebular gas
In all spectra shown in Fig. 3 the [NII] and [SII] doublets are well resolved, and the relatively weak [OI]6300 Å and [OI]6334 Å lines can be made out. The Hβ4861 Å and [OIII]5007 Å are seen only in the S and N2 spectra, which extend sufficiently blueward (recall Fig. 3).
A comparison of the diagnostic line ratios in Table 2 with those of the Galactic HII region IC 1805 (Figs. 12 and 13 in Lagrois et al. 2012) clearly shows that the Simeis 57 spectra are those of photoionized gas in an HII region at all positions. Only at the southern position a small amount of shock-ionized gas may be mixed in as well. The [SII] doublet ratios of about 1.4 indicate low electron densities ne ~ 30 cm−3 to ne ~ 100 cm−3 if Te = 10 000 K (Osterbrock & Ferland 2006). These are very close to the r.m.s. electron densities  of 60 ± 15 cm−3 determined from the radio maps by Israel et al. (2003) adapted to D = 1.7 kpc, implying clumping factors of about unity, that is, a smooth ionized gas distribution.
The Hα, Hβ, and [SII] images in Fig. 4 reveal very similar spatial distributions of ionized hydrogen and ionized sulfur, differing only in detail. The peculiar “propeller” shape of the nebula stands out; the clear break in the middle is apparently caused by intervening dust. Taking our cue from the line spectra in Fig. 3, we subtracted a constant [NII] contribution of 35% from the emission measured in the Hα filter before constructingthe [SII]-to-Hα ratio map in Fig. 10. Over most of the nebula, this ratio is ~ 0.35, as expected for thermal emission from HII regions (cf. Fig. 12 from Lagrois et al. 2012). Closer inspection of Fig. 10, however, reveals a thin ridge of ratios ≥0.4 along the western edges of both DWB 111 and DWB 119, that is, higher than expected for pure thermal emission. This is marginal evidence for local shocks occurring at the edge of Simeis 57, which is consistent with the comment we made above. The radio continuum spectral index map (Fig. 7 of Israel et al. 2003) does not show any trace of nonthermal radio emission so that this is at best a minor constituent.
[SII] emission is prominent in region C (the “spur”) northwest of the obscured center where no oxygen is seen. The intensities of ionized sulfur [SII] and ionized oxygen [OIII] are largely anticorrelated as essentially all sulfur is ionized up to [SIII] or [SIV] in the [OIII] emitting zone. The distribution of ionized oxygen ([OIII]) is very different from that of the ionized hydrogen. It is more diffuse and the propeller shape is not prominent. In region A (DWB 111), the [OIII] emission is in thin ridges east of the northern propeller “blade”. There is virtually no diffuse [OIII] emission west of it.
The southern propeller region B (DWB 119), which is bright in the Balmer lines and the radio continuum, does not show up at all in [OIII]. There is, however, relatively bright and extended [OIII] emission to its east, also in directions of weak Balmer line emission.
The WISE mid-infrared images and especially the IRAS and Akari far-infrared images likewise show dust and [OIII] emission to be anticorrelated. They show diffuse extended infrared emission west of the propeller but a near lack east of the nebula, where the [OIII] emission is prevalent. It appears that there is a general lack of material in sight lines east of Simeis 57 and that the ionized gas at the eastern edges is much more highly excited than the dusty gas to the west.
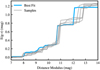 |
Fig. 8 Reddening with distance based on Green et al. (2019). The gray lines indicate stellar samples; the blue line indicates the best model. |
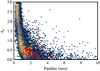 |
Fig. 9 Gaia visual extinction (Ag in mag) vs. parallax (in milli-arcsec) for all stars with high-quality data within one degree of Simeis 57. Highlighted in this sample are 49 bright blue stars moving in predominantly NS (yellow dots) or EW (red dots) directions. |
Diagnostic spectroscopic line ratios.
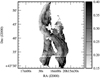 |
Fig. 10 Distribution of [SII]/Hα line flux ratios. Only pixels with significant emission are included. The observed Hα intensities have been corrected for a 35% contributionfrom the nearby [NII] lines. The dark spots, gaps, and a horizontal bar are artifacts from different seeing conditions and the dithering procedure. The light gray contours are radio contours as in Fig. 2. |
3.3 Dust extinction toward Simeis 57
To establish properties of Simeis 57 such as its Hα luminosity, distance, and source of ionization, we need to constrain the dust extinction toward Simeis 57. This can be done using the Balmer line and radio continuum intensities. The Hα and Hβ line intensities and the color excess are related via (see for details Momcheva et al. 2013)
![Mathematical equation: \begin{equation*}\begin{split}E(B-V) &\,{=}\, \frac{E(\textrm{H}\beta-\textrm{H}\alpha)}{k(\lambda_{\textrm{H}\beta})-k(\lambda_{\textrm{H}\alpha})}\\&\,{=}\, \frac{2.5}{k(\lambda_{\textrm{H}\beta})-k(\lambda_{\textrm{H}\alpha})} \log \Big[\frac{(\textrm{H}\alpha/\textrm{H}\beta)_{\textrm{int}}}{(\textrm{H}\alpha/\textrm{H}\beta)_{\textrm{obs}}} \Big]\end{split}\end{equation*}](/articles/aa/full_html/2021/06/aa39372-20/aa39372-20-eq2.png) (1)
(1)
where k(λ) is the wavelength-dependent value of the reddening curve and  and
and  are the unreddened and observed line ratios, respectively. Assuming Case B recombination at Te = 10 000 K conditions (Draine 2011), we expect (Hα/Hβ)int = 2.86. E(Hβ −Hα) is defined analogous to E(B − V). For a standard Milky Way reddening law (Cardelli et al. 1989) we find
![Mathematical equation: \begin{equation*}\begin{split}E(\textrm{H}\beta - \textrm{H}\alpha) &\,{=}\, -2.50 \log\,\Big[\frac{(\textrm{H}\alpha/\textrm{H}\beta)_{\textrm{int}}}{(\textrm{H}\alpha/\textrm{H}\beta)_{\textrm{obs}}} \Big]\,{=}\,0.77\,{\pm}\,0.37\\E(B-V) &\,{=}\, -1.97 \log\,\Big[\frac{(\textrm{H}\alpha/\textrm{H}\beta)_{\textrm{int}}}{(\textrm{H}\alpha/\textrm{H}\beta)_{\textrm{obs}}} \Big]\,{=}\,0.60\,{\pm}\, 0.29\end{split}\end{equation*}](/articles/aa/full_html/2021/06/aa39372-20/aa39372-20-eq5.png) (2)
(2)
With
 (3)
(3)
we obtain
 (4)
(4)
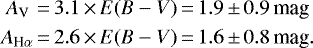
The extinction implied by the reddening of the Balmer lines is consistent with the result obtained by Israel et al. (2003) and the average Galactic visual extinction rate of 1.8m per kiloparsec (Whittet 2002).
The Hα line and 1420 MHz radio continuum images are very similar since the emission mechanisms are intimately related. Unlike the Hα line, the emission at radio frequencies does not suffer extinction and the intensity ratio of the two images allows for a direct determination of the extinction across the entire nebula. With the new Hα image, the earlier attempt by Israel et al. (2003) can be improved in sensitivity and detail; the limiting factor is now the resolution (58″ × 80″) of the 1420 MHz DRAO radio continuum map. For electron temperatures Te = 10 000 K, we expect optically thin free-free continuum and Hα line emissivities
 (5)
(5)
yielding an extinction-free ratio
 (6)
(6)
which may be compared to observed ratios. In the extinction map thus constructed (Fig. 11), we masked the regions with F1420 ≤ 10 mJy arcmin−2 and assumed an extinction law A(λ) ~ λ−1, so that AV ≈ 1.2 AHα.
In this map, the elongated extinction feature north of the center of Simeis 57 coincides with part of the long radio filament mentioned before. Its southern continuation has a radio counterpart (DBW 118; region D) seemingly suffering only modest extinction. Most of the bright Hα emission associated with the radio source suffers relatively little extinction and is consistent with dust in the foreground line of sight. The extinction in Fig. 11 agrees well with the reddening implied by the Balmer lines alone, leaving little room for the “gray” extinction that would betray dust internal to the ionized gas. The strong absorption feature just to the northeast of the nebula center has an infrared counterpart cataloged as IRAS PSC 20 145+4333, denoted in Fig. 5, which appears diffuse and resolved.
We usedthe mean extinction AHα = 1.6m to convert the Hα flux of region A+B in Table 3 into the intrinsic Hα luminosity
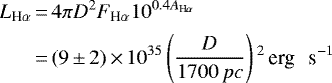 (7)
(7)
For case B recombination, T = 10 000 K and n ~ 102 cm−3, the number of absorbed (stellar) Lyman continuum photons NLyc is related to LHα via (cf. Kennicutt et al. 1995)
 (8)
(8)
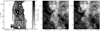 |
Fig. 11 Visual extinction map and millimeter CO data of Simeis 57. Left: extinction expressed in visual magnitudes across Simeis 57. Radio continuum contours S1420 = 20, 25, 30 mJy arcmin−2 are superposed. The box indicates the outline of the two panels to the right. Center: JCMT 13CO contours (+5km s−1 component) superposed on the blue digital Palomar Sky Survey (DSS) image. Right: JCMT 13CO contours (−10 km s−1 component) superposed on blue DSS image. |
Area-integrated line fluxes.
3.4 Infrared emission from dust
In Fig. 5, emission from hot dust is seen at 12 μm and 12 μm tracing the linear filament separating regions A and B. It is unrelated to the nebula itself and has no far-infrared counterpart from cooler dust.
The propeller-shaped nebula is seen at wavelengths from 22 μm to 100 μm. In the WISE 22 μm image, the emission from hot dust traces the northern DWB 111 blade, whereas warm dust in the southern DWB 119 blade is more prominent in the Akari 65 μm image. The compact dusty region IRAS 20145+4333 (see IRAS 100 μm image) is clearly present longward of 22 μm. It does not have the appearance of an embedded stellar object. In comparison with other Galactic sources, the infrared emission from Simeis 57 is insignificant. Unlike its optical counterpart, the object does not stand out in infrared images at any wavelength.
We extracted the infrared brightnesses available from the IRAS and Akari databases, estimating the infrared background from the empty region east of the object. We derived the area-integrated infrared fluxes of the central compact object IRAS 20145+4333and the whole nebula (Table 4). The infrared luminosity of the compact region is only  (using Lee et al. 1996). Its spectral shape matches that of an embedded OB star (Wood & Churchwell 1989) but the luminosity is orders of magnitude below that expected for such a star. Even when integrated over the much larger area of 550 arcmin2, the infrared luminosity of the entire nebula remains low at
  . By fitting a modified blackbody (Battersby et al. 2011) to the AKARI and IRAS data with a β = 1.6 emissivity, we find a model dust temperature TD ≈ 36 K.
At the assumed distance of 1.7 kpc, the above value of LTIR corresponds to the luminosity of an embedded ~B1.5V star with an absolute visual magnitude MV ≈−2.8 mag (Panagia 1973; Crowther 2005). This is only a minimum estimate as the radiating dust may subtend a solid angle as seen from the star substantially less than 4π. For instance, if only 10% of the sky were blocked by dust, an O7 star with MV = −4.2 mag would be needed, and with a blockage of only 1% an O4/O5 star with MV = −5.8 mag. The analysis of the observed radio continuum or Balmer line emission leads to similar results.
Area-integrated infrared fluxes.
3.5 Molecular clouds and Simeis 57
The observations show surprisingly little CO emission toward Simeis 57. Unlike typical HII regions, the optical nebula is much larger than the associated molecular cloud. The surrounding field lacks major molecular clouds and only contains a number of isolated small molecular clouds in a narrow velocity range (VLSR = +4 to +6 km−1) Fig. 6. These “red” clouds, of 3–8 pc in size, coincide with undistinguished far-infrared features (Fig. 5). None of these clouds show signs of external or internal heating, for instance by an embedded star.
Peak line intensities are modest and line profiles are narrow (line widths 0.7–1.3 km s−1), which is characteristic of relatively cold, quiescent molecular gas. The J = 1-0 12CO/13CO isotopolog ratios R10 range from 4.5 ± 0.5 to 7.0 ± 0.8. The small “blue” cloud at the center of Simeis 57 has a negative velocity VLSR = −10.9 km s−1 (cf. Fig. 6), which is the same as the recombination line velocity of the ionized gas VLSR = −12 km s−1 (Pipenbrink & Wendker 1988). Its isotopolog ratio is higher (R10 = 11.0 ± 0.3), which suggests a lower CO optical depth.
The more detailed JCMT maps show (Fig. 7) the CO clouds coinciding closely with individual absorption patches in the visual image (Fig. 11). Especially, the blue cloudlets at the same radial velocity as the optical nebula have clear counterparts in well-defined extinction patches. The elongated red cloud coincides with the extinction feature extending from the nebular center to the south along DWB 119. This cloud is also in front of the nebula, but given its different velocity, it may be at an intervening distance.
The multiple-transition CO data allow for the derivation of the physical conditions of the molecular gas with the radiative transfer code RADEX (van der Tak et al. 2007). We assume an intrinsic isotopolog ratio [12 CO]/[13CO] of 60, a carbon abundance [C]/[H] = 8.45 (cf. Arellano-Córdova et al. 2020), and a carbon gas-phase depletion factor of a third. The blue cloud core then represents a relatively large column ( ) of rather warm (Tkin ≥ 30 K) molecular gas with a low density (
 = 100 cm−3) that is close to the nebular gas density (Sect. 3.2). The dust and molecular gas of this cloud appears to be integral part of the nebula. In contrast, the more extended red cloud core has a higher density (1000 cm−3) but a lower column density (~1 × 1021 cm−2) with a temperature unconstrained by the observations. With standard gas-to-extinction ratios (Zhu et al. 2017) the blue cloud has an AV ≈ 2m and the red cloud AV ≈ 1m. Most of the molecular gas and dust traced by the CO clouds is in front of the nebula. There are no signs of embedded sources of excitation and the molecular gas column densities imply extinctions much too low for the obscuration of luminous stars. Thus, the Simeis 57 complex is not hiding its source of excitation and we must look for it in the much larger surrounding field of fragmentarymolecular cloudlets, nebular filaments, and scattered stars.
3.6 Starsin the Simeis 57 field
The ultraviolet and optical images in Figs. 5 and 11 might suggest that Simeis 57 is associated with a small group of luminous blue stars. It should be noted that several of the stars seen in the UV images can be recognized at longer wavelengths up to 4.6 μm in the near-infrared image and some can even be seen in the mid-infrared at 12 μm and 22 μm. Because the wavelength-dependent interstellar extinction increases steeply toward the ultraviolet, the stars in the UV images are unlikely to suffer much extinction either locally or in the foreground.
Appendix A shows the continuum spectra and associated data of 20 prominent stars near Simeis 57 (13 of which can be identified in Fig. 5). As argued there, most of these stars are ruled out as a source of excitation for Simeis 57 on grounds of spectral type, brightness, or distance. No exciting star can be identified close to the nebula. Only the star HD 193793 = WR 140 also known as the variable star V1687 Cyg or the spectroscopic binary SBC9 1232 (Pourbaix et al. 2004) emerges as a suitable candidate, albeit at the large projected distance 50′ to the east of the nebula (cf. Figs. 1 and A.1). At the stellar distance of 1.71 ± 0.11 kpc (Smith et al. 2012; Rate & Crowther 2020), this corresponds to a projected linear separation of about 23 pc. If this star and Simeis 57 are associated, they are roughly in the same plane on the sky because Simeis 57 is seen projected close to the edge of the shell surrounding HD 193793 in the radio and dust maps shown by Arnal (2001).
HD 193793 consists of an evolved O4-5 star (MV = −6.9m) and a WC7p Wolf–Rayet star (MV = − 6.3m) with respective luminosities log L(O5I)∕L⊙ = 6.20 and log L(WC7)∕L⊙ = 5.34 (Williams 2011). It is located in a void in the HI distribution (Arnal 2001) and suffers a line-of-sight extinction AV = 2.9 (Williams 2011). If Simeis 57 is at the same distance as HD 193793, its gas depth as defined by the radio emission would be  pc (uncertain by a factor of about two).
In that case it covers a solid angle of ~0.06 steradian. This corresponds to blocking 0.5% of the sky, also with a factor of two uncertainty. We took the model Lyman continuum photon fluxes of a WC7 star from Crowther (2007) and those of an O5I star from Sternberg et al. (2003) and scaled them with the corresponding observed-to-model luminosity ratios. We find a combined production rate log NLyc(star) = 50.12 ph s−1. There appears to be little or no absorbing gas and dust between the star and the nebula (Arnal 2001), so that an intercept rate Nlyc(neb) = 1047.8 ph s−1 is predicted for the nebula. This is practically identical to the rate derived from the Hα observations in Sect. 3.3. The intercepted infrared luminosity should be about LTIR ~ 104L⊙, that is, about equal to the total luminosity of the nebula. If Simeis 57 is either closer or more distant than WR140, the numbers change somewhat but remain comfortably within the uncertainty limits. A significant difference, for instance by an amount equal to its projected distance, is unlikely because this would place the nebula well beyond the limits of the shell marking the sphere of influence of the star.
The binary HD 193793 = WR140 is thus the most likely source for the excitation of the nebula. In particular, the UV Lyman continuum output of the WR star is consistent with the strong [OIII] emission in the eastern half of the nebula and the expected output of the system is in excellent agreement with the ionization rate implied by the observationsof the nebula. In several aspects, such as the evolved nature of the exciting star, its outside location, the [OIII]/Hα emission line asymmetry, and the filamentary appearance, Simeis 57 much resembles the California Nebula (NGC 1499) excited by the hot runaway star ξ Persei (O7.5III). An investigation into the dynamics of the nebular gas might be rewarding in studies of the interstellar medium of the region and the evolution of an early O/WC binary such as HD 193793.
4 Conclusions
In the previous paper on Simeis 57, Israel et al. (2003) found that the emission of the nebula is thermal, ruling out that it is a supernova remnant. Its peculiar shape is suggestive of a rotating outflow from either an evolving young object such as an HII region or an old evolved object such as a planetary nebula. In either case, we would expect to find a centrally located source of excitation.
This paper establishes that the nebula has a relatively low density on the order of 100 cm−3 and suffers an extinction of not much more than 2m. Optical spectroscopy reveals an excitation gradient with significant [OIII] emission east of the main body and very little [OIII] emission to the west. The nebula is recognizable but not prominent in mid-infrared and far-infrared images. There is no major CO cloud complex but small (4–8 pc) CO clouds, all at VLSR ≈ +5 km s−1, are scattered across the field. One of these clouds coincides with the nebula and another fragmentary cloud at the nebular velocity of VLSR ≈−10 km s−1. They do not appear to be physically connected and both are smaller than the ionized nebula. They have substantial substructure. The CO data suggest molecular gas densities of 1000 cm−3 and 100 cm−3 and modest column densities N(H2) = 1 − 2 × 1021 cm−2. These data clearly establish that Simeis 57 is not part of a larger star-forming complex, but is an isolated object in a larger field filled with fragmentary gas and dust clouds. No luminous stars are embedded in the dust nor are any hidden by it; there are no central objects.
The larger field surrounding the nebula reveals only one probable excitation source. This is the evolved binary HD 193793 consisting of an O4-5 supergiant and a WC7 Wolf–Rayet star (WR 140) at a well-established distance of D = 1.71 kpc and with a projected distance of 23 pc to the nebula. Both its luminosity and the hardness of its UV radiation appear sufficient to explain the excitation of Simeis 57. Moreover, its location to the east of the nebula fits well with the observed [OIII] emission asymmetry. It thus appears that the nebula Simeis 57 consists of separate filaments and diffuse emission that together only fortuitously produce the remarkably coherent appearance of an outflow object.
Acknowledgements
We are indebted to Ardjan Sturm and Christian Groeneveld for their help with the May 2017 INT-WFC observations and discussions. We also thank Fedde Fagginger Auer, Margot Leemker, Martijn Wilhelm and Tom Sweegers for conducting the 2016 INT-WFC observations. We thank the telescope operators (TOs) of the James Clerk Maxwell Telescope (JCMT) for conducting the observations described in this paper. At the time, the JCMT was operated by the Joint Astronomy Centre (JAC) in Hilo, Hawaii, on behalf of the Particle Physics and Astronomy Research Council (P-PARC) of the United Kingdom, the Netherlands Organization for Scientific Research (NWO), and the National Research Council (NRC) of Canada. J.B. acknowledges support by Fundação para a Ciência e a Technologia (FCT) through the research grants UID/FIS/04434/2019, UIDB/04434/2020, UIDP/04434/2020 and through the Investigador FCT Contract No. IF/01654/2014/CP1215/CT0003. This work has made use of data from the European Space Agency (ESA) mission Gaia (https://www.cosmos.esa.int/gaia), processed by the Gaia Data Processing and Analysis Consortium (DPAC, https://www.cosmos.esa.int/web/gaia/dpac/consortium). Funding for the DPAC has been provided by national institutions, in particular the institutions participating in the Gaia Multilateral Agreement. This research made use of Montage, funded by the National Aeronautics and Space Administration’s Earth Science Technology Office, Computational Technologies Project, under Cooperative Agreement Number NCC5-626 between NASA and the California Institute of Technology. The code is maintained by the NASA/IPAC Infrared Science Archive. This research has made use of the SIMBAD database, operated at CDS, Strasbourg, France
Appendix A Stellar neighborhood
The continuum spectra of 20 relatively prominent stars near Simeis 57, identified in Fig. A.1, are shown in Fig. A.2. Thirteen of these stars are also contained in the UV-to-FIR images from Fig. 5. The stellar fluxes were taken from Simbad (Wenger et al. 2000), which was accessed through the CDS portal. Photometric measurements are mostly part of all-sky surveys. Catalogs and instruments included in the data are as follows: the Sloan Digital Sky Survey (SDSS) (Aguado et al. 2019), the 2MASS All-Sky Catalog of Point Sources (Cutri et al. 2003), WISE (Wright et al. 2010; Jarrett et al. 2011), Tycho-2 and the Tycho Input Catalogue Pickles & Depagne (2010); Egret et al. (1992); Ofek (2008), the MSX6C Infrared Point Source Catalog (Egan et al. 2003), AKARI (Takita et al. 2010), Pan-STARRS (Magnier et al. 2013), Gaia (Gaia Collaboration 2016, 2018), the All-Sky Compiled Catalogue (Kharchenko & Roeser 2009), Hipparcos (Perryman et al. 1997), The AAVSO PhotometricAll-Sky Survey (APASS) (Henden et al. 2009), the IRAS PSC/FSC Combined Catalogue (Abrahamyan et al. 2015), the IPHAS DR2 Source Catalogue (Barentsen et al. 2014), the (Second-Generation) Guide Star Catalog (Lasker et al. 2008), the Catalogue of new Herbig Ae/Be and classical Be stars (Vioque et al. 2020), DIRBE Near-infrared Stellar Light Curves (Price et al. 2010), the U.S. Naval Observatory Catalog of Positions of Infrared Stellar Sources (Hindsley & Harrington 1994), and Parameters and IR excesses of Gaia DR1 stars (McDonald et al. 2017).
For many stars, a small fraction of the photometric fluxes returned by CDS portal fall significantly below the stellar spectrum. In almost all cases, these photometric data points are part of the Pan-STARRS catalog. For the same wavelength, multiple (up to four) photometric data points are returned with different fluxes. For each of the Pan-STARRS filters, one of the photometric points is consistent with the stellar spectrum as defined by data from other catalogs and Gaia. In these cases, we deleted the other points. For two stars, the photometric fluxes in the IPHAS Source Catalogue were significantly below those other compilations at similar wavelengths, and in particular below the Gaia measurements. Since the accuracy of Gaia is higher than that of the IPHAS catalog, we also removed the IPHAS data points for these two stars.
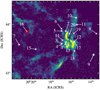 |
Fig. A.1 Identification chart of bright stars near Simeis 57 for which continuum spectra are shown in Fig. A.2. The red cross denotes star No. 16 (HD 193793/WR140 aka the spectroscopic binary SBC9 1232 (Pourbaix et al. 2004)), which is the most likely candidate for the exciting star of Simeis 57. Background map is as in Fig. 1. |
Four of the stars (Nos. 7, 16, 19, and 20) are at distances close to the estimated distance of Simeis 57, whereas the distance of two stars (Nos. 1 and 18) is unknown. Stars Nos. 2, 3, 9, 10, 11, 12, 13, 15, and 17 are all too nearby and have spectral types too late to be of interest here. Stars Nos. 5, 6, 8, and 14 are relatively luminous stars of early type A0, but their output of ionizing UV photons is still too small to matter nor are they sufficiently distant. The spectral type of stars Nos. 1, 4, 7, 18, 19, and 20 is unknown. The IRAS PSC stars Nos. 18 and 19, prominent in the WISE images of Fig. 5, appear to be dust-embedded stars of relatively low luminosity. This leaves for consideration stars Nos. 1, 4, 7, 16, and 20. Only star No. 16 (HD 193793) seems bright enough. As the spectroscopic binary SBC9 1232 (Pourbaix et al. 2004), it consists of an evolved O4/O5 supergiant and the WC7p Wolf-Rayet star WR 140 at a distance of 1.7 kpc with a combined luminosity of about 2 × 10⁶ L⊙.
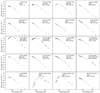 |
Fig. A.2 Continuum spectra of stars identified in Fig A.1. The distanced are as available in Simbad (Wenger et al. 2000). |
References
- Abrahamyan, H. V., Mickaelian, A. M., & Knyazyan, A. V. 2015, Astron. Comput., 10, 99 [Google Scholar]
- Aguado, D. S., Ahumada, R., Almeida, A., et al. 2019, ApJS, 240, 23 [Google Scholar]
- Arellano-Córdova, K. Z., Esteban, C., García-Rojas, J., & Méndez-Delgado, J. E. 2020, The Galactic radial abundance gradients of C, N, O, Ne, S, Cl and Ar from deep spectra of H II regions [Google Scholar]
- Armengot, M., Sánchez, N., López-Santiago, J., & de Castro, A. I. G. 2014, Astrophys. Space Sci., 354, 113 [Google Scholar]
- Arnal, E. M. 2001, AJ, 121, 413 [Google Scholar]
- Aumann, H. H., Fowler, J. W., & Melnyk, M. 1990, AJ, 99, 1674 [Google Scholar]
- Bally, J., Langer, W. D., Stark, A. A., & Wilson, R. W. 1987, ApJ, 312, L45 [NASA ADS] [CrossRef] [Google Scholar]
- Barentsen, G., Farnhill, H. J., Drew, J. E., et al. 2014, VizieR Online Data Catalog, II/321 [Google Scholar]
- Battersby, C., Bally, J., Ginsburg, A., et al. 2011, A&A, 535, A128 [NASA ADS] [CrossRef] [EDP Sciences] [Google Scholar]
- Bertin, E. 2006, in Astronomical Society of the Pacific Conference Series, 351, Astronomical Data Analysis Software and Systems XV, eds. C. Gabriel, C. Arviset, D. Ponz, & S. Enrique, 112 [Google Scholar]
- Bertin, E., & Arnouts, S. 1996, A&AS, 117, 393 [NASA ADS] [CrossRef] [EDP Sciences] [Google Scholar]
- Cardelli, J. A., Clayton, G. C., & Mathis, J. S. 1989, ApJ, 345, 245 [NASA ADS] [CrossRef] [Google Scholar]
- Cash, W., Charles, P., Bowyer, S., et al. 1980, ApJ, 238, L71 [Google Scholar]
- Crowther, P. A. 2005, in Massive Star Birth: A Crossroads of Astrophysics, eds. R. Cesaroni, M. Felli, E. Churchwell, & M. Walmsley, 227, 389 [Google Scholar]
- Crowther, P. A. 2007, ARA&A, 45, 177 [NASA ADS] [CrossRef] [Google Scholar]
- Cutri, R. M., Skrutskie, M. F., van Dyk, S., et al. 2003, VizieR Online Data Catalog, II/246 [Google Scholar]
- Dickel, H. R., Wendker, H., & Bieritz, J. H. 1969, A&A, 1, 270 [NASA ADS] [Google Scholar]
- Doi, Y., Takita, S., Ootsubo, T., et al. 2015, PASJ, 67, 50 [NASA ADS] [Google Scholar]
- Draine, B. T. 2011, Physics of the Interstellar and Intergalactic Medium (Princeton University Press) [Google Scholar]
- Drew, J. E., Greimel, R., Irwin, M. J., et al. 2005, MNRAS, 362, 753 [NASA ADS] [CrossRef] [Google Scholar]
- Egan, M. P., Price, S. D., Kraemer, K. E., et al. 2003, VizieR Online Data Catalog, V/114 [Google Scholar]
- Egret, D., Didelon, P., McLean, B. J., Russell, J. L., & Turon, C. 1992, A&A, 258, 217 [NASA ADS] [Google Scholar]
- Erben, T., Schirmer, M., Dietrich, J. P., et al. 2005, Astron. Nachr., 326, 432 [Google Scholar]
- Gaia Collaboration (Prusti, T., et al.) 2016, A&A, 595, A1 [NASA ADS] [CrossRef] [EDP Sciences] [Google Scholar]
- Gaia Collaboration (Brown, A. G. A., et al.) 2018, A&A, 616, A1 [NASA ADS] [CrossRef] [EDP Sciences] [Google Scholar]
- Gaze, V. F., & Shajn, G. A. 1951, Izv. Krym. Astrofiz. Obs., 7, 93 [NASA ADS] [Google Scholar]
- Gaze, V. F., & Shajn, G. A. 1955, Izv. Krym. Astrofiz. Obs., 15, 11 [NASA ADS] [Google Scholar]
- Green, G. M., Schlafly, E. F., Zucker, C., Speagle, J. S., & Finkbeiner, D. P. 2019, ApJ, 887, 93 [Google Scholar]
- Henden, A. A., Welch, D. L., Terrell, D., & Levine, S. E. 2009, in American Astronomical Society Meeting Abstracts, 214, 407.02 [Google Scholar]
- Hindsley, R. B., & Harrington, R. S. 1994, AJ, 107, 280 [NASA ADS] [CrossRef] [Google Scholar]
- Israel, F. P., Kloppenburg, M., Dewdney, P. E., & Bally, J. 2003, A&A, 398, 1063 [CrossRef] [EDP Sciences] [Google Scholar]
- Jarrett, T. H., Cohen, M., Masci, F., et al. 2011, ApJ, 735, 112 [Google Scholar]
- Kennicutt, R. C., Bresolin, F., Bomans, D. J., Bothun, G., & Thompson, I. B. 1995, Astron. J., 109, 594 [NASA ADS] [CrossRef] [Google Scholar]
- Kharchenko, N. V., & Roeser, S. 2009, VizieR Online Data Catalog, I/280B [Google Scholar]
- Lagrois, D., Joncas, G., & Drissen, L. 2012, MNRAS, 420, 2280 [CrossRef] [Google Scholar]
- Lasker, B. M., Lattanzi, M. G., McLean, B. J., et al. 2008, AJ, 136, 735 [NASA ADS] [CrossRef] [PubMed] [Google Scholar]
- Lee, Y., Snell, R. L., & Dickman, R. L. 1996, ApJ, 472, 275 [CrossRef] [Google Scholar]
- Magnier, E. A., Schlafly, E., Finkbeiner, D., et al. 2013, ApJS, 205, 20 [NASA ADS] [CrossRef] [Google Scholar]
- Mahy, L., Rauw, G., De Becker, M., Eenens, P., & Flores, C. A. 2015, A&A, 577, A23 [NASA ADS] [CrossRef] [EDP Sciences] [Google Scholar]
- McDonald, I., Zijlstra, A. A., & Watson, R. A. 2017, MNRAS, 471, 770 [NASA ADS] [CrossRef] [Google Scholar]
- Momcheva, I. G., Lee, J. C., Ly, C., et al. 2013, ApJ, 145, 47 [NASA ADS] [CrossRef] [Google Scholar]
- Neugebauer, G., Habing, H., Duinen, R., et al. 1984, ApJ, 278, L1 [Google Scholar]
- Ofek, E. O. 2008, PASP, 120, 1128 [NASA ADS] [CrossRef] [Google Scholar]
- Osterbrock, D. E., & Ferland, G. J. 2006, Astrophysics of Gaseous Nebulae and Active Galactic Nuclei (University Science Books) [Google Scholar]
- Panagia, N. 1973, AJ, 78, 929 [NASA ADS] [CrossRef] [Google Scholar]
- Parker, R. A. R., Gull, T. R., & Kirshner, R. P. 1979, An emission-line survey of the Milky Way, Vol. 434 (NASA-Washington: Scientific and Technical Inform) [Google Scholar]
- Perryman, M. A. C., Lindegren, L., Kovalevsky, J., et al. 1997, A&A, 500, 501 [NASA ADS] [Google Scholar]
- Pickles, A., & Depagne, É. 2010, PASP, 122, 1437 [NASA ADS] [CrossRef] [Google Scholar]
- Pipenbrink, A., & Wendker, H. J. 1988, A&A, 191, 313 [Google Scholar]
- Poole, T. S., Breeveld, A. A., Page, M. J., et al. 2008, MNRAS, 383, 627 [Google Scholar]
- Pourbaix, D., Tokovinin, A. A., Batten, A. H., et al. 2004, A&A, 424, 727 [NASA ADS] [CrossRef] [EDP Sciences] [Google Scholar]
- Price, S. D., Smith, B. J., Kuchar, T. A., Mizuno, D. R., & Kraemer, K. E. 2010, ApJS, 190, 203 [NASA ADS] [CrossRef] [Google Scholar]
- Rate, G., & Crowther, P. A. 2020, MNRAS, 493, 1512 [CrossRef] [Google Scholar]
- Rygl, K. L. J., Brunthaler, A., Sanna, A., et al. 2012, A&A, 539, A79 [NASA ADS] [CrossRef] [EDP Sciences] [Google Scholar]
- Schirmer, M. 2013, ApJS, 209, 21 [NASA ADS] [CrossRef] [Google Scholar]
- Schlafly, E. F., & Finkbeiner, D. P. 2011, ApJ, 737, 103 [NASA ADS] [CrossRef] [Google Scholar]
- Skrutskie, M., Cutri, R., Stiening, R., et al. 2006, AJ, 131, 1163 [NASA ADS] [CrossRef] [Google Scholar]
- Smith, I. A., Dougherty, S. M., & Beasley, A. J. 2012, in Astronomical Society of the Pacific Conference Series, 465, Proceedings of a Scientific Meeting in Honor of Anthony F. J. Moffat, ed. L. Drissen, C. Robert, N. St-Louis, & A. F. J. Moffat, 336 [Google Scholar]
- Sternberg, A., Hoffmann, T. L., & Pauldrach, A. W. A. 2003, ApJ, 599, 1333 [NASA ADS] [CrossRef] [Google Scholar]
- Takita, S., Kataza, H., Kitamura, Y., et al. 2010, A&A, 519, A83 [NASA ADS] [CrossRef] [EDP Sciences] [Google Scholar]
- Uyan"i"ker, B., Fürst, E., Reich, W., Aschenbach, B., & Wielebinski, R. 2001, A&A, 371, 675 [NASA ADS] [CrossRef] [EDP Sciences] [Google Scholar]
- van der Tak, F. F. S., Black, J. H., Schöier, F. L., Jansen, D. J., & van Dishoeck, E. F. 2007, A&A, 468, 627 [NASA ADS] [CrossRef] [EDP Sciences] [Google Scholar]
- van Dokkum, P. G., Bloom, J., & Tewes, M. 2012, L.A.Cosmic: Laplacian Cosmic Ray Identification, Astrophysics Source Code Library [Google Scholar]
- Vioque, M., Oudmaijer, R. D., Schreiner, M., et al. 2020, A&A, 638, A21 [Google Scholar]
- Wenger, M., Ochsenbein, F., Egret, D., et al. 2000, A&AS, 143, 9 [NASA ADS] [CrossRef] [EDP Sciences] [Google Scholar]
- Whittet, D. C. 2002, Dust in the galactic environment (CRC press) [Google Scholar]
- Williams, P. 2011, Bull. Soc. Roy. Sci. Liege, 80, 595 [Google Scholar]
- Wood, D. O., & Churchwell, E. 1989, ApJ, 340, 265 [NASA ADS] [CrossRef] [Google Scholar]
- Wright, E. L., Eisenhardt, P. R. M., Mainzer, A. K., et al. 2010, AJ, 140, 1868 [Google Scholar]
- Zhu, H., Tian, W., Li, A., & Zhang, M. 2017, MNRAS, 471, 3494 [NASA ADS] [CrossRef] [Google Scholar]
We verified that the improvements in the more recent Gaia eDR3 do not discernibly change the results described in this work.
For an RV = 3.1 reddening law, E(B − V) ~ 0.981 E(g − r) (see Schlafly & Finkbeiner 2011).
All Tables
All Figures
|
Fig. 1 Mosaic of Hα line emissionin the 3° × 3° region surrounding Simeis 57, centered on α = 20h17m50.4s, δ = + 43°01′48”. The white box indicates the region studied in this paper, which is enlarged in Fig. 2. |
| In the text | |
|
Fig. 2 Hα line emission map of Simeis 57 with the subregions A, B, C, and D. The black contours correspond to DRAO 1420 MHz radio continuum flux densities of 20, 25, and 30 mJy arcmin−2. The red crosses denote the central positions of the IDS long-slit spectra from Table 1 and Fig. 3. |
| In the text | |
|
Fig. 3 Spatially integrated long slit spectra at the positions indicated in Fig. 2. Fluxes are in units of 10−16 erg cm−2 s−1 Å−1. |
| In the text | |
|
Fig. 4 Continuum-subtracted line images of Simeis 57 in identical fields of view. From left to right: [SII](6716+6730), Hα+[NII], Hβ, and [OIII]5007. In these images, the first contour corresponds to Iλ = (5.6, 18, 5, 1.4) × 10−17 erg s−1 cm−2 arcsec−2, respectively. Subsequent contours increase by factors of 1.5. The contours in the Hα +[NII] map represent the pure Hα flux. The Hβ image was not dithered and suffers from camera artifacts and gaps between the CCDs. |
| In the text | |
|
Fig. 5 UV, optical, and infrared images of Simeis 57. Each image shows the same region of 0.4 × 0.4 deg centered on α = 304.04, δ = 43.69. The UV images comprise SWIFT UVOT (λeff = 1928 Å) and GALEXnear-UV (λeff = 2310 Å) exposures. Optical broadband images include those from our INT WFC observations with the filters sloan g (λ0 = 4846 Å) and sloan r (λ0 = 6240 Å). Near-infrared images are 2MASS J and Ks band at wavelengths of 1.25 μm and 2.2 μm and WISE band 2 to 4 images at wavelengths of 4.6, 12, and 22 μm. Far-infrared images are AKARI 65, enhanced IRAS 100, and AKARI 160 μm. The point source IRAS 20145+4333 is denoted by a red cross in the HIRES 100 μm map. Contours correspond to DRAO 1420MHz radio continuum intensities of 20, 25, 30 mJy arcmin−2. |
| In the text | |
|
Fig. 6 Undersampled J = 1–0 12CO (left panels) and 13CO (right panels) maps of molecular clouds in the field of Simeis 57, whose center is denoted by a cross. The emission at +5 km s−1 is shown in the leftmost two panels (averaged over a 5 km s−1 velocity interval), and the central two panels show the emission at −10 km s−1 (averaged over a 4 km s−1 interval). In the 12CO panels, the regions with improved sampling are indicated by a solid-line boundary. The rightmost two panels show the position–velocity map along the dashed line in the 13CO map. Position offsets are relative to α = 20h16m16.7s, δ = + 43°47′54″ (J = 2000). |
| In the text | |
|
Fig. 7 Fully sampled J = 2–113CO maps in the field centered on Simeis 57 (offset relative to α = 20h16m08.2s, δ = 43°41′02.4″) smoothed to a resolution of 30″. At left is the emission at +5 km s−1 (averaged over a 6 km s−1 velocity interval), in the center the emission at −10 km s−1 (averaged over a 10 km s−1 interval), and at right the position–velocity distribution. |
| In the text | |
|
Fig. 8 Reddening with distance based on Green et al. (2019). The gray lines indicate stellar samples; the blue line indicates the best model. |
| In the text | |
|
Fig. 9 Gaia visual extinction (Ag in mag) vs. parallax (in milli-arcsec) for all stars with high-quality data within one degree of Simeis 57. Highlighted in this sample are 49 bright blue stars moving in predominantly NS (yellow dots) or EW (red dots) directions. |
| In the text | |
|
Fig. 10 Distribution of [SII]/Hα line flux ratios. Only pixels with significant emission are included. The observed Hα intensities have been corrected for a 35% contributionfrom the nearby [NII] lines. The dark spots, gaps, and a horizontal bar are artifacts from different seeing conditions and the dithering procedure. The light gray contours are radio contours as in Fig. 2. |
| In the text | |
|
Fig. 11 Visual extinction map and millimeter CO data of Simeis 57. Left: extinction expressed in visual magnitudes across Simeis 57. Radio continuum contours S1420 = 20, 25, 30 mJy arcmin−2 are superposed. The box indicates the outline of the two panels to the right. Center: JCMT 13CO contours (+5km s−1 component) superposed on the blue digital Palomar Sky Survey (DSS) image. Right: JCMT 13CO contours (−10 km s−1 component) superposed on blue DSS image. |
| In the text | |
|
Fig. A.1 Identification chart of bright stars near Simeis 57 for which continuum spectra are shown in Fig. A.2. The red cross denotes star No. 16 (HD 193793/WR140 aka the spectroscopic binary SBC9 1232 (Pourbaix et al. 2004)), which is the most likely candidate for the exciting star of Simeis 57. Background map is as in Fig. 1. |
| In the text | |
|
Fig. A.2 Continuum spectra of stars identified in Fig A.1. The distanced are as available in Simbad (Wenger et al. 2000). |
| In the text | |
Current usage metrics show cumulative count of Article Views (full-text article views including HTML views, PDF and ePub downloads, according to the available data) and Abstracts Views on Vision4Press platform.
Data correspond to usage on the plateform after 2015. The current usage metrics is available 48-96 hours after online publication and is updated daily on week days.
Initial download of the metrics may take a while.