Fig. 11
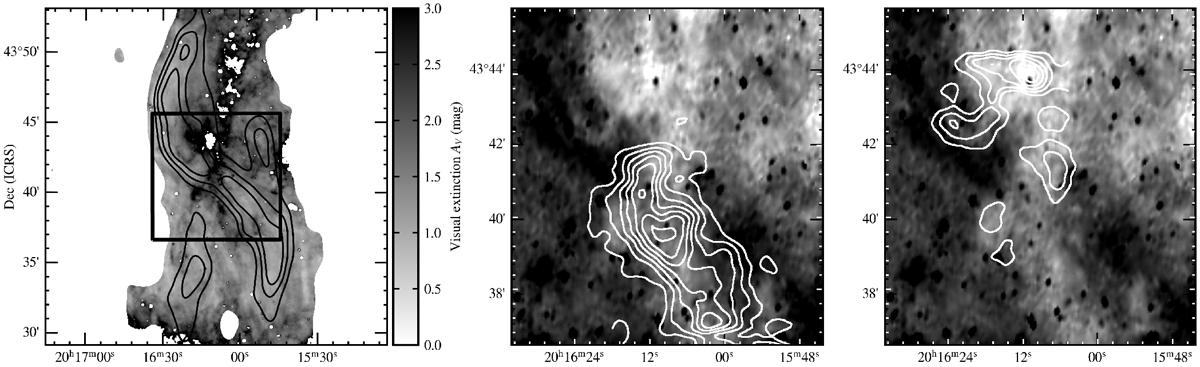
Visual extinction map and millimeter CO data of Simeis 57. Left: extinction expressed in visual magnitudes across Simeis 57. Radio continuum contours S1420 = 20, 25, 30 mJy arcmin−2 are superposed. The box indicates the outline of the two panels to the right. Center: JCMT 13CO contours (+5km s−1 component) superposed on the blue digital Palomar Sky Survey (DSS) image. Right: JCMT 13CO contours (−10 km s−1 component) superposed on blue DSS image.
Current usage metrics show cumulative count of Article Views (full-text article views including HTML views, PDF and ePub downloads, according to the available data) and Abstracts Views on Vision4Press platform.
Data correspond to usage on the plateform after 2015. The current usage metrics is available 48-96 hours after online publication and is updated daily on week days.
Initial download of the metrics may take a while.