Fig. 7
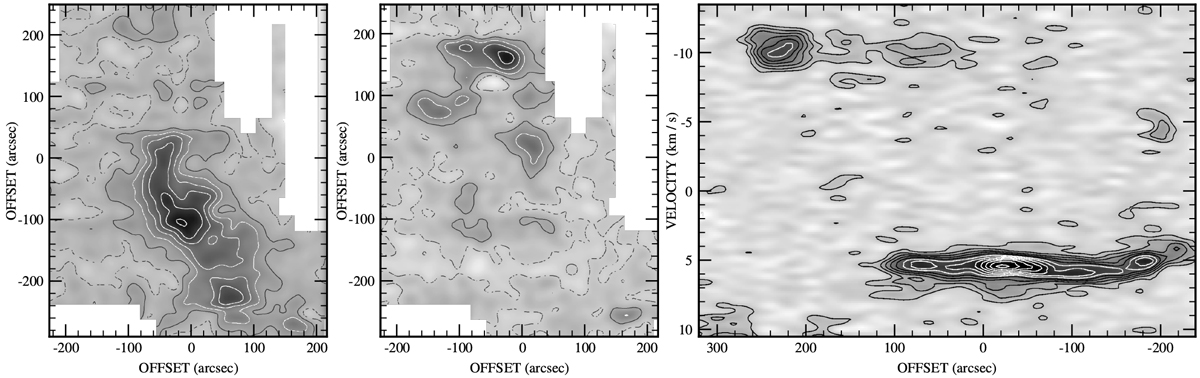
Fully sampled J = 2–113CO maps in the field centered on Simeis 57 (offset relative to α = 20h16m08.2s, δ = 43°41′02.4″) smoothed to a resolution of 30″. At left is the emission at +5 km s−1 (averaged over a 6 km s−1 velocity interval), in the center the emission at −10 km s−1 (averaged over a 10 km s−1 interval), and at right the position–velocity distribution.
Current usage metrics show cumulative count of Article Views (full-text article views including HTML views, PDF and ePub downloads, according to the available data) and Abstracts Views on Vision4Press platform.
Data correspond to usage on the plateform after 2015. The current usage metrics is available 48-96 hours after online publication and is updated daily on week days.
Initial download of the metrics may take a while.