Fig. 5
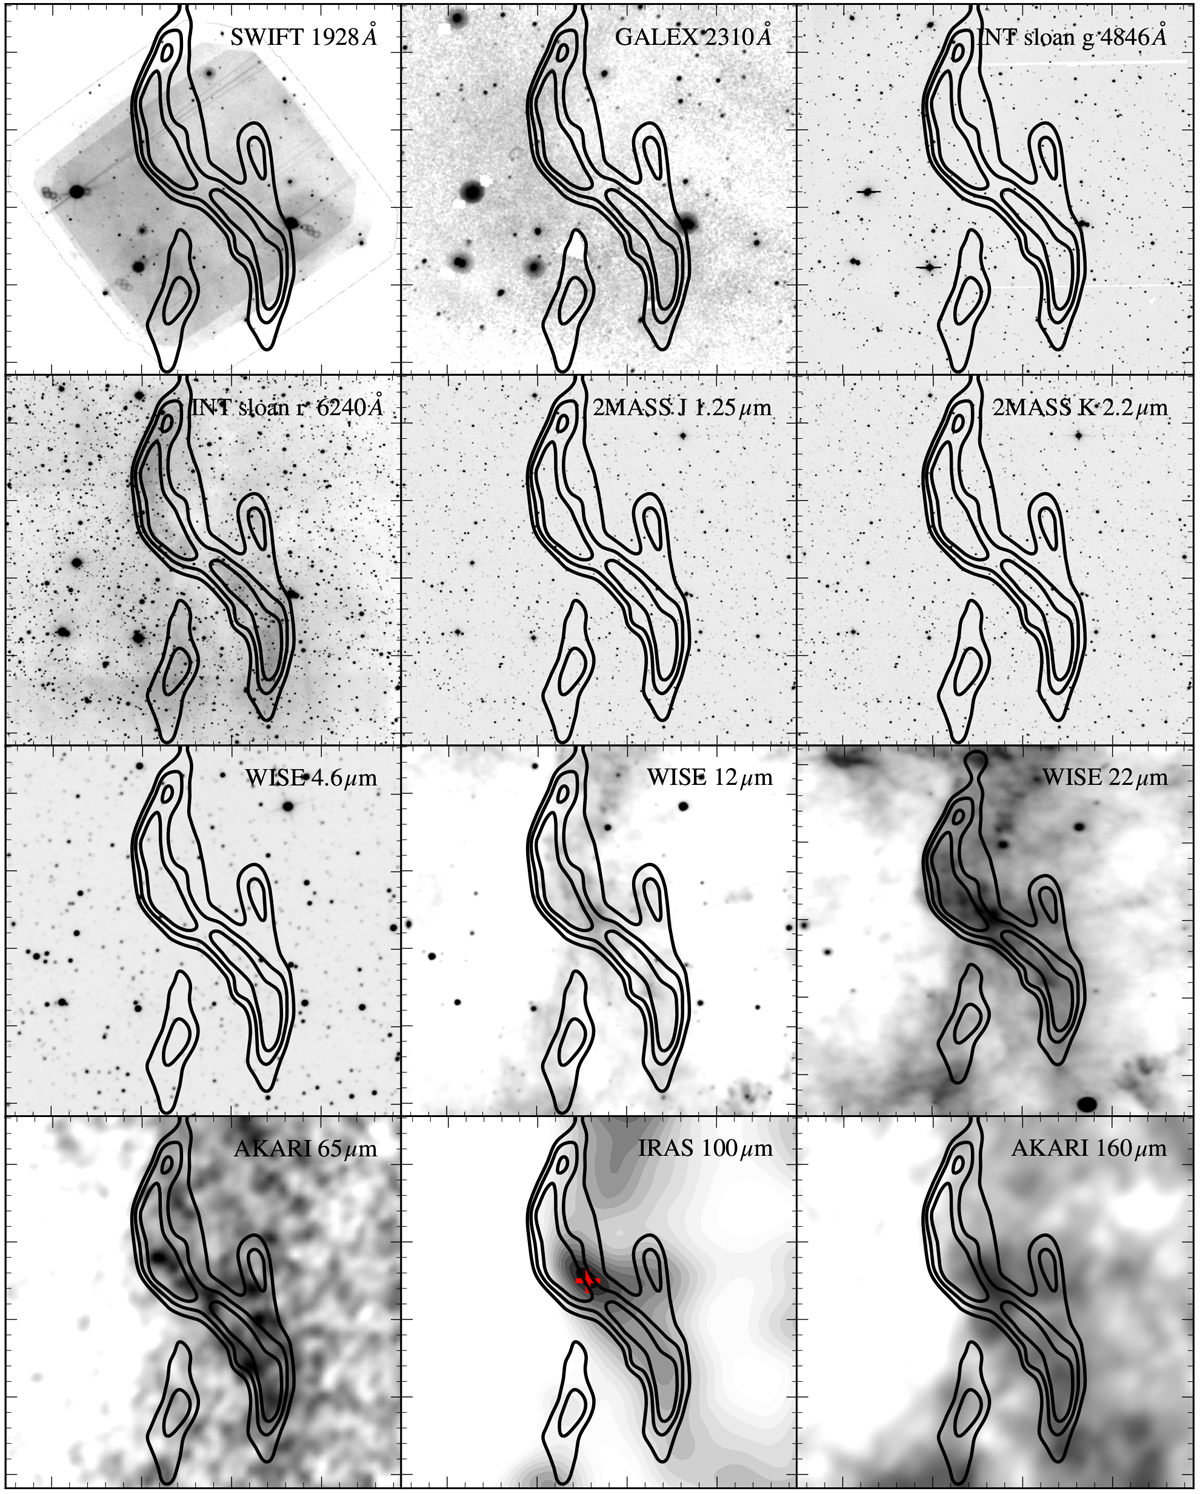
UV, optical, and infrared images of Simeis 57. Each image shows the same region of 0.4 × 0.4 deg centered on α = 304.04, δ = 43.69. The UV images comprise SWIFT UVOT (λeff = 1928 Å) and GALEXnear-UV (λeff = 2310 Å) exposures. Optical broadband images include those from our INT WFC observations with the filters sloan g (λ0 = 4846 Å) and sloan r (λ0 = 6240 Å). Near-infrared images are 2MASS J and Ks band at wavelengths of 1.25 μm and 2.2 μm and WISE band 2 to 4 images at wavelengths of 4.6, 12, and 22 μm. Far-infrared images are AKARI 65, enhanced IRAS 100, and AKARI 160 μm. The point source IRAS 20145+4333 is denoted by a red cross in the HIRES 100 μm map. Contours correspond to DRAO 1420MHz radio continuum intensities of 20, 25, 30 mJy arcmin−2.
Current usage metrics show cumulative count of Article Views (full-text article views including HTML views, PDF and ePub downloads, according to the available data) and Abstracts Views on Vision4Press platform.
Data correspond to usage on the plateform after 2015. The current usage metrics is available 48-96 hours after online publication and is updated daily on week days.
Initial download of the metrics may take a while.