Fig. 6
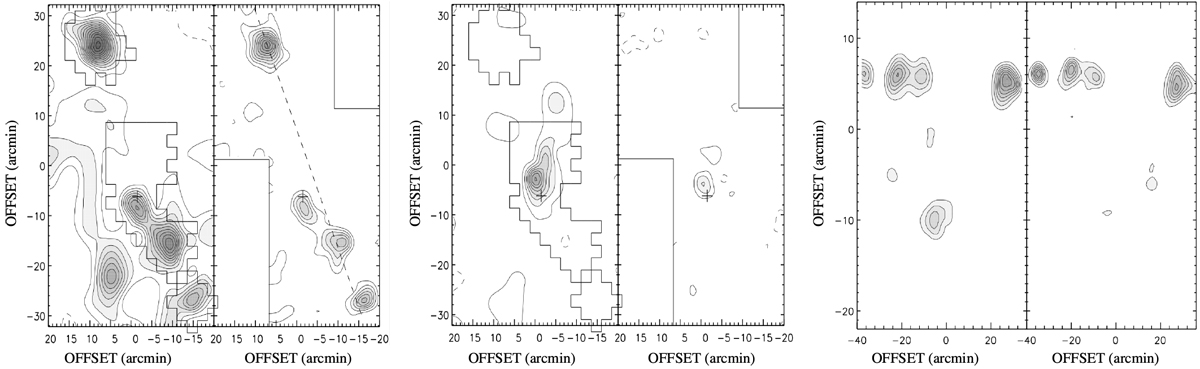
Undersampled J = 1–0 12CO (left panels) and 13CO (right panels) maps of molecular clouds in the field of Simeis 57, whose center is denoted by a cross. The emission at +5 km s−1 is shown in the leftmost two panels (averaged over a 5 km s−1 velocity interval), and the central two panels show the emission at −10 km s−1 (averaged over a 4 km s−1 interval). In the 12CO panels, the regions with improved sampling are indicated by a solid-line boundary. The rightmost two panels show the position–velocity map along the dashed line in the 13CO map. Position offsets are relative to α = 20h16m16.7s, δ = + 43°47′54″ (J = 2000).
Current usage metrics show cumulative count of Article Views (full-text article views including HTML views, PDF and ePub downloads, according to the available data) and Abstracts Views on Vision4Press platform.
Data correspond to usage on the plateform after 2015. The current usage metrics is available 48-96 hours after online publication and is updated daily on week days.
Initial download of the metrics may take a while.